

BUTTERFLY
WHERE EVENTS AND PERSONAL GOALS INTERSECT.
LEISURE ACTIVITY EXPLORER
Overview
Role:
Timeline:
December 2024 - February 2025
Teammates:
Figma, FigJam, Canva, Google Forms, Google Slides, Zoom
Teammates:
William Steffey, Bianca Walker, Ken Alvarez, Shilpa Francis, and Atharv Deshpande
Problem:
Leisure Activity Explorer
“How might we help individuals discover and book new leisure activities that align with their interests, schedules, and locations? (by offering personalized recommendations, social sharing options, and opportunities to connect with like-minded people).”
Goal
An app that helps users easily discover and book events aligned with their personal goals and interests, while fostering meaningful connections through personalized recommendations, social sharing, and opportunities to connect with like-minded people.
Client:
The Muellers, hosts of the podcast “Hard to Make Friends As An Adult,” organize community events across Texas.
Business Goal
To expand the “It’s Hard to Make Friends As An Adult” brand into a scalable digital product by creating BUTTERFLY—an app that increases user engagement and community growth, drives event participation, and opens opportunities for partnerships, memberships, and long-term monetization through curated experiences.
User research, Date Visualization, User flow, Information Architecture, Wireframing, Visual design, Usability testing
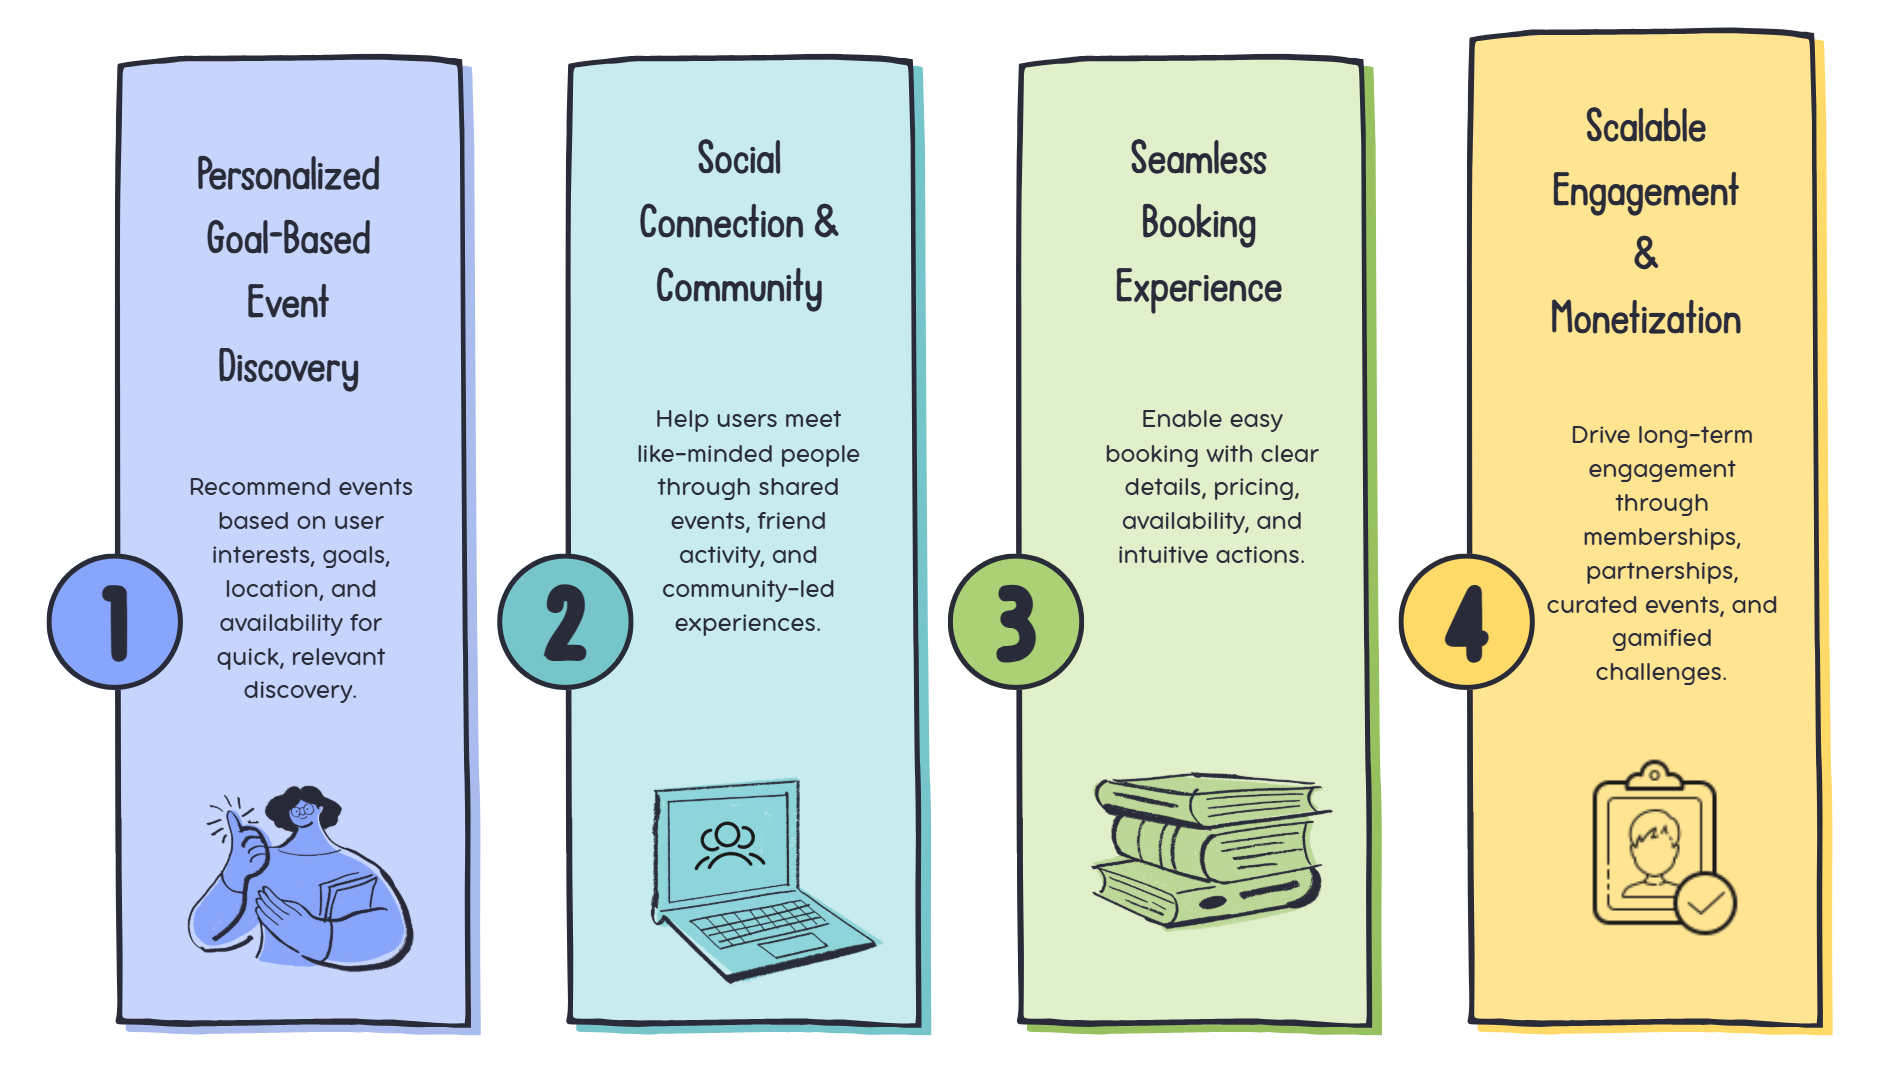
The Solution
The Story Behind the Project
Project Strategy & Challenges
The goal of Butterfly was to help adults easily discover events and connect with like-minded people. The strategy focused on creating a simple, social, and accessible experience. The project balanced personalization, community engagement, and tight timelines while ensuring the design met user needs and supported growth.
Personalization Complexity
Recommending events that match user interests, goals, location, and availability.
Privacy & Safety
Designing social features that protect user data and ensure safe interactions.
Onboarding & Engagement
Encouraging new users to explore the app without feeling overwhelmed.
Information Overload
Organizing events and community features so users can easily find what’s relevant.
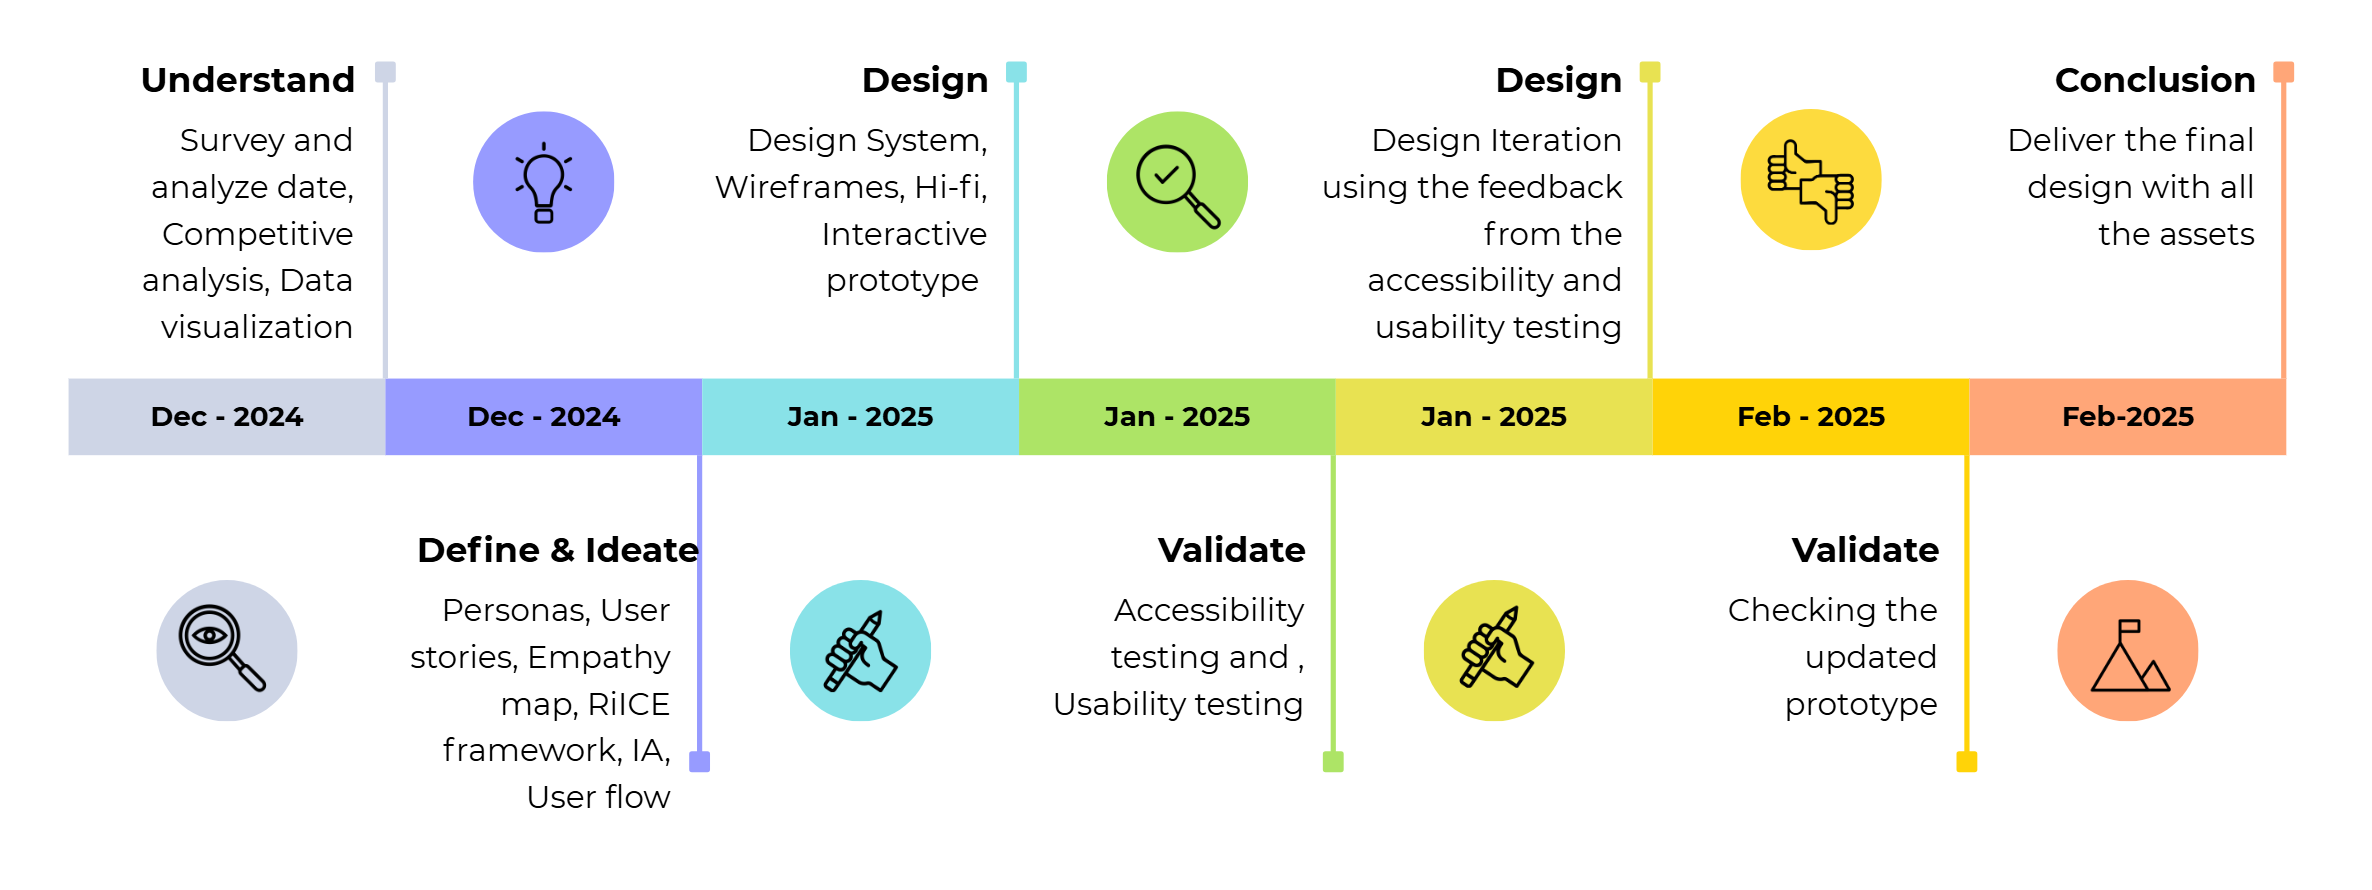
Road Map

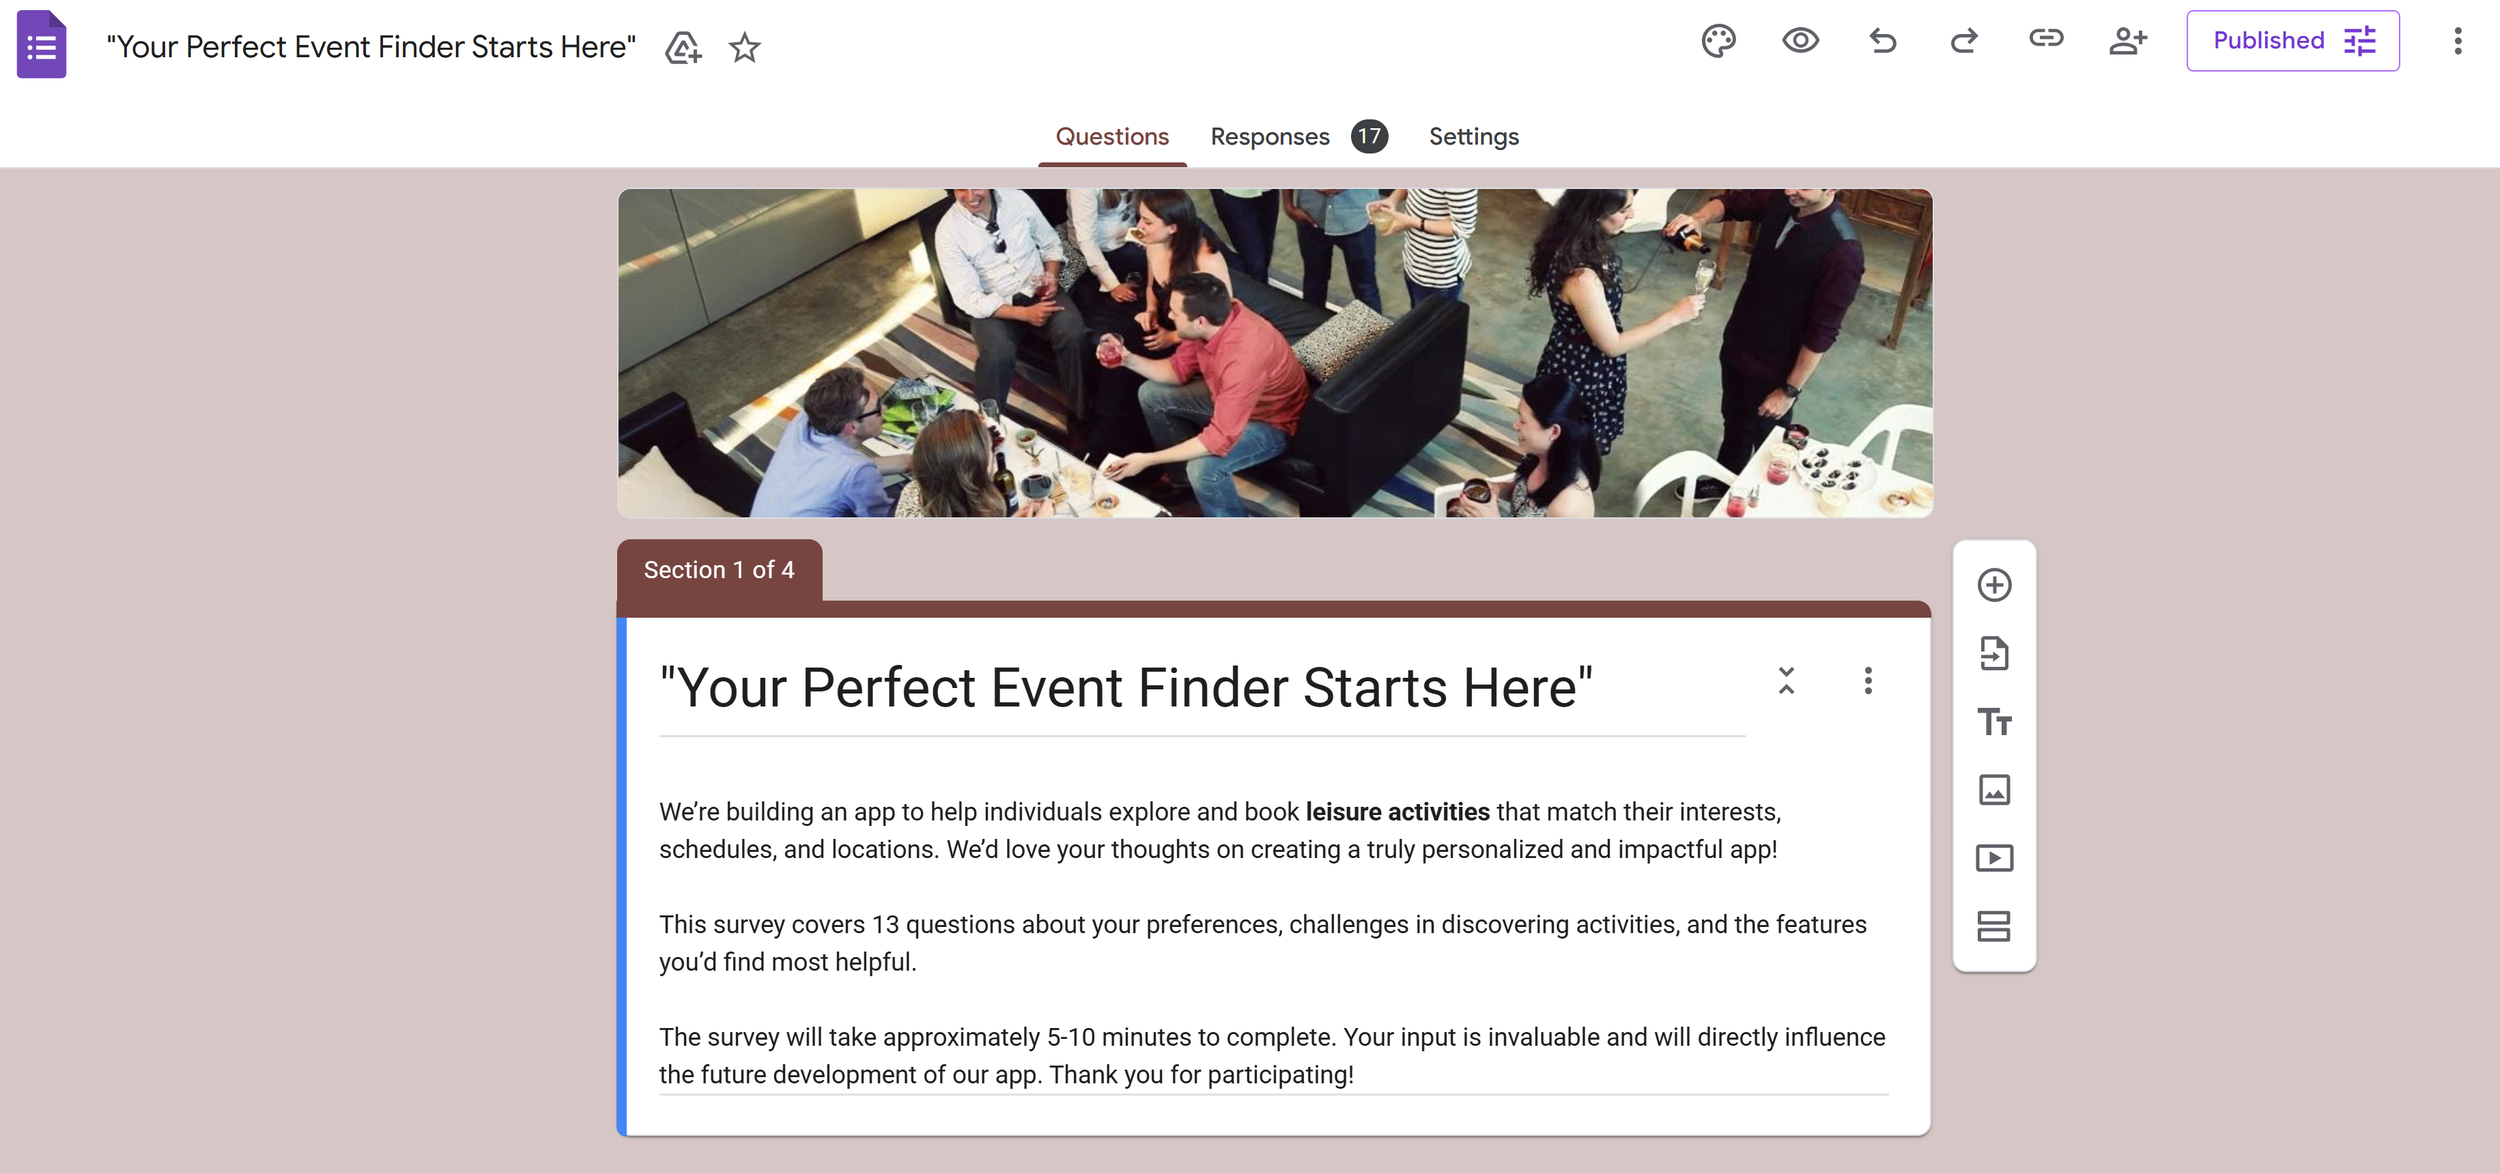
My team and I began the project with user research to better understand user needs and behaviors. We created a set of focused survey questions and shared them through a Google Form with a diverse group of participants. We received 17 responses, which we analyzed to identify patterns, pain points, and motivations. These insights directly informed our design decisions and helped shape the core features of the Butterfly app.
Survey Methodology:
Survey Google Forms

User Research
Research Objectives:
Understand user preferences and pain points
Evaluate current event-booking methods
Research users aged 18–65+ across diverse lifestyles
Identify gaps where new events and experiences could be created
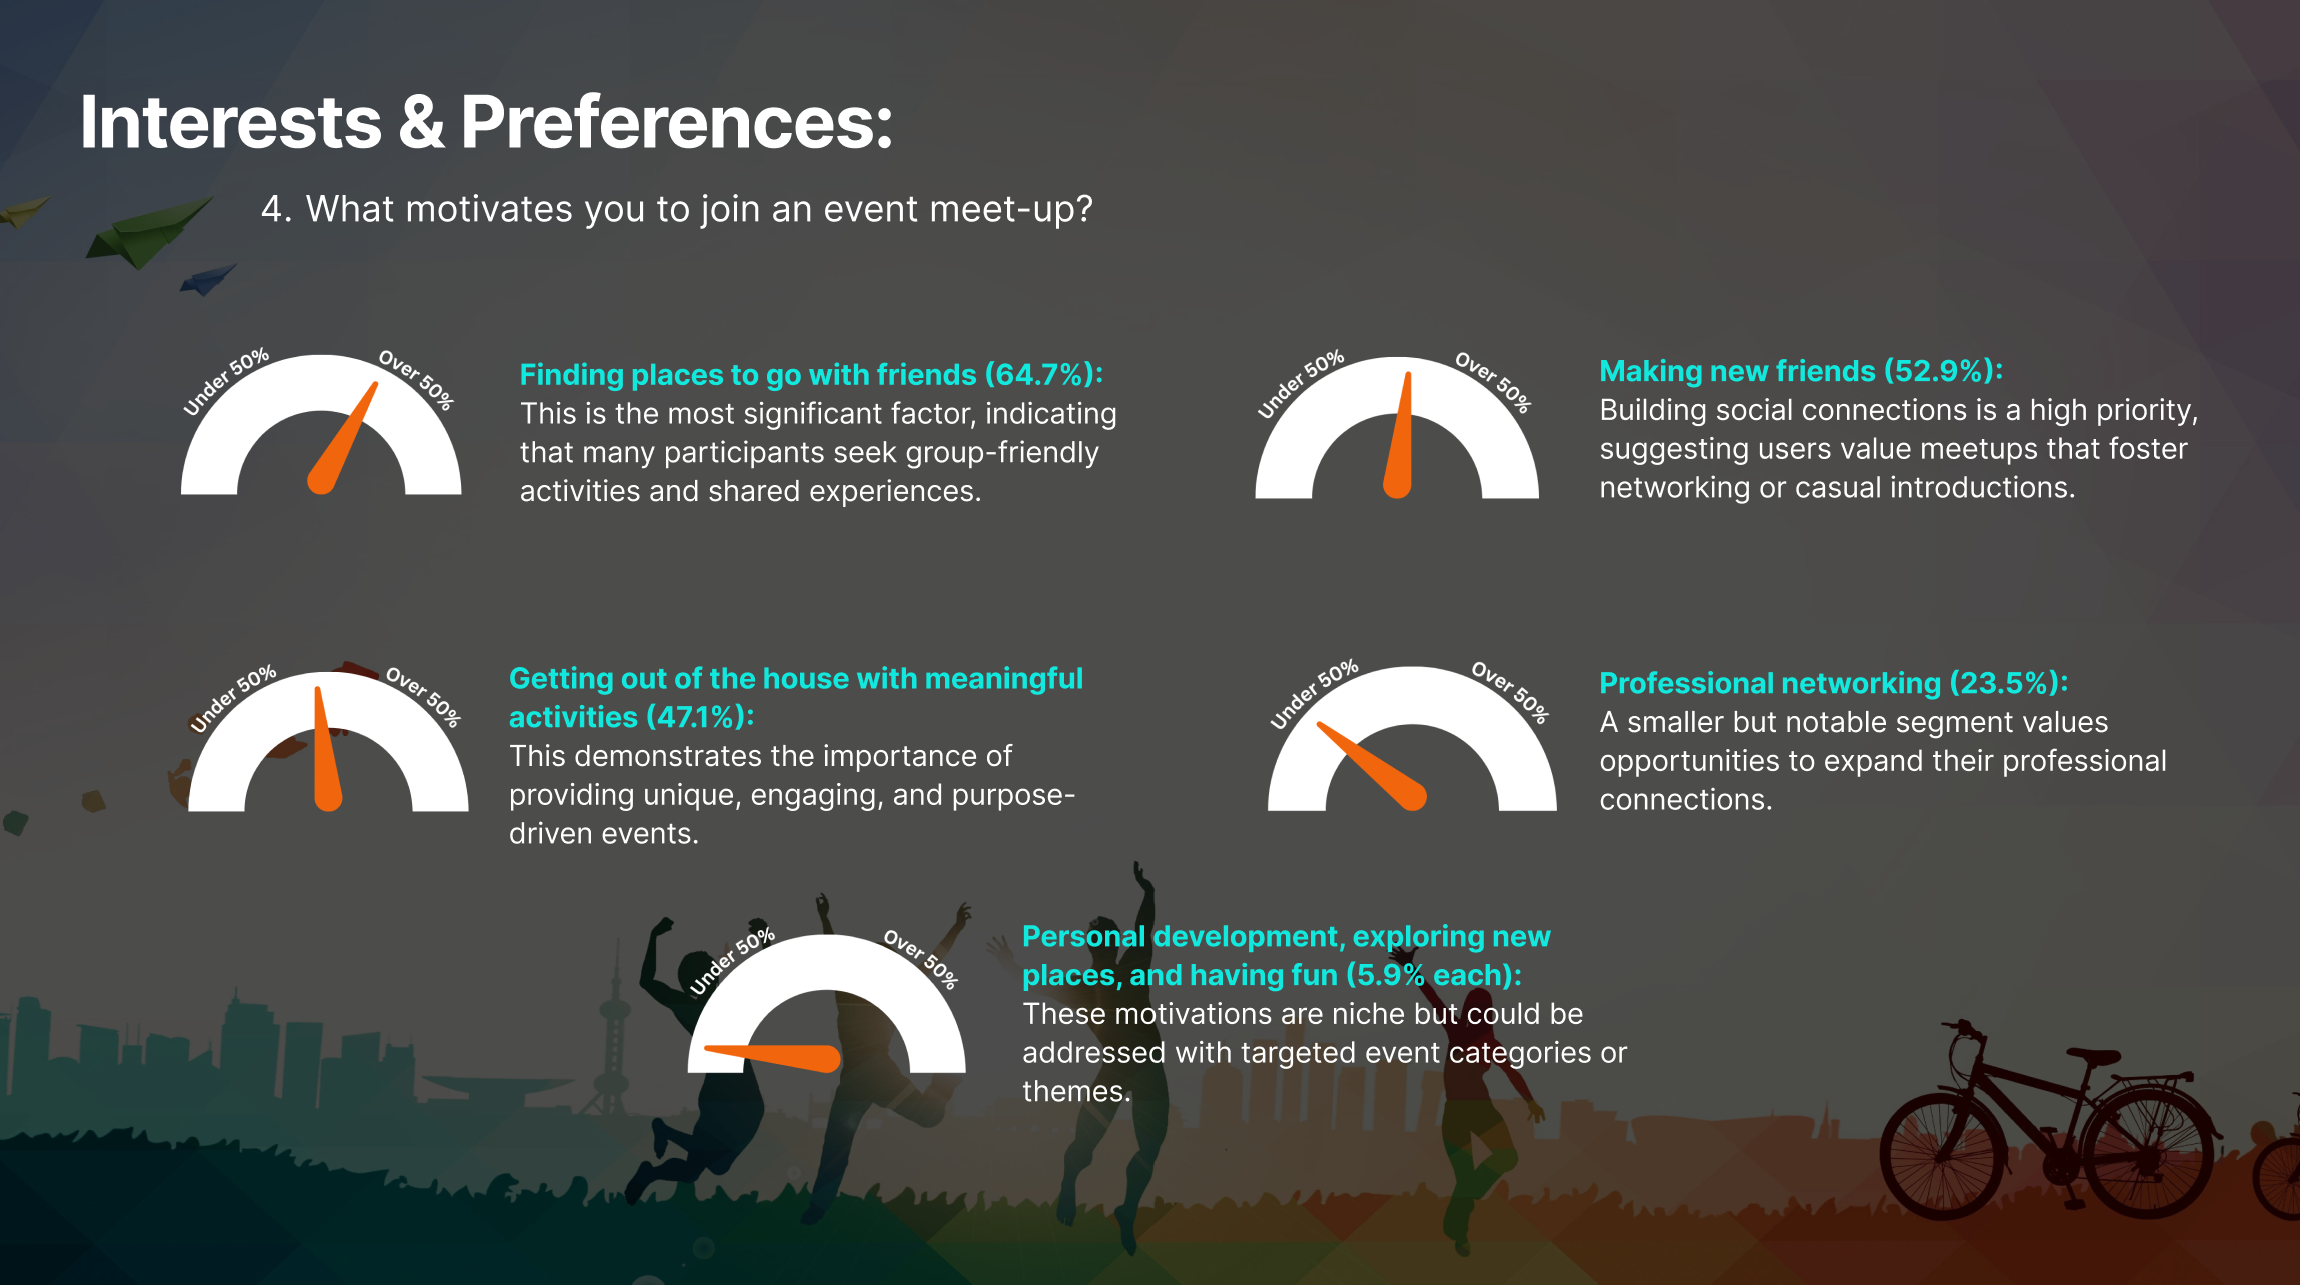
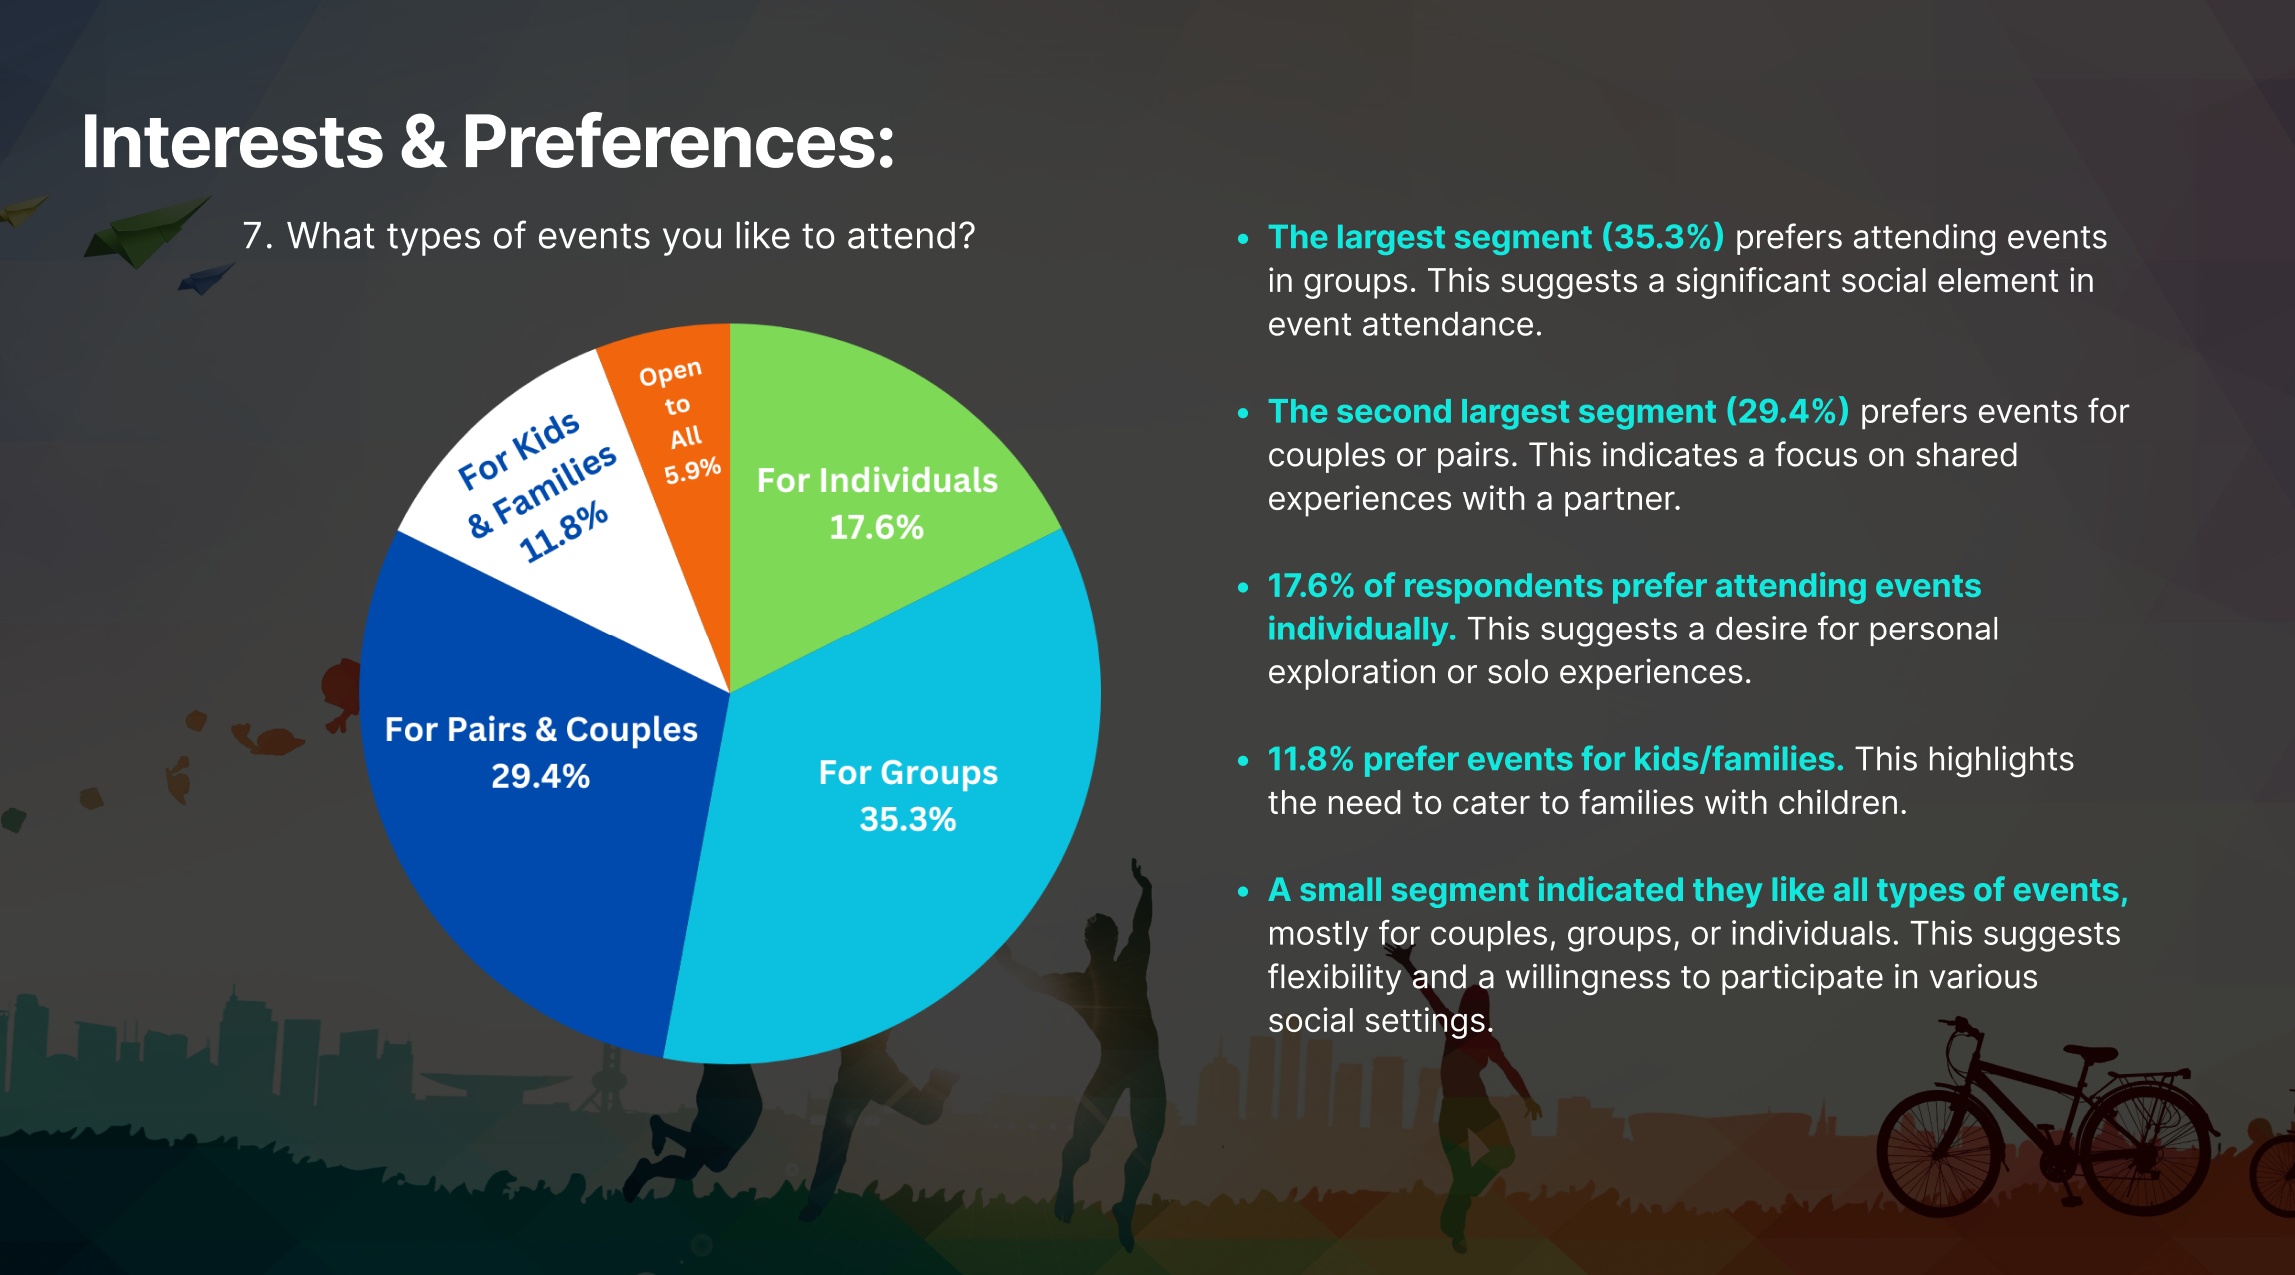
Insights
Users prefer group- and couple-friendly activities
Strong interest in social and leisure experiences
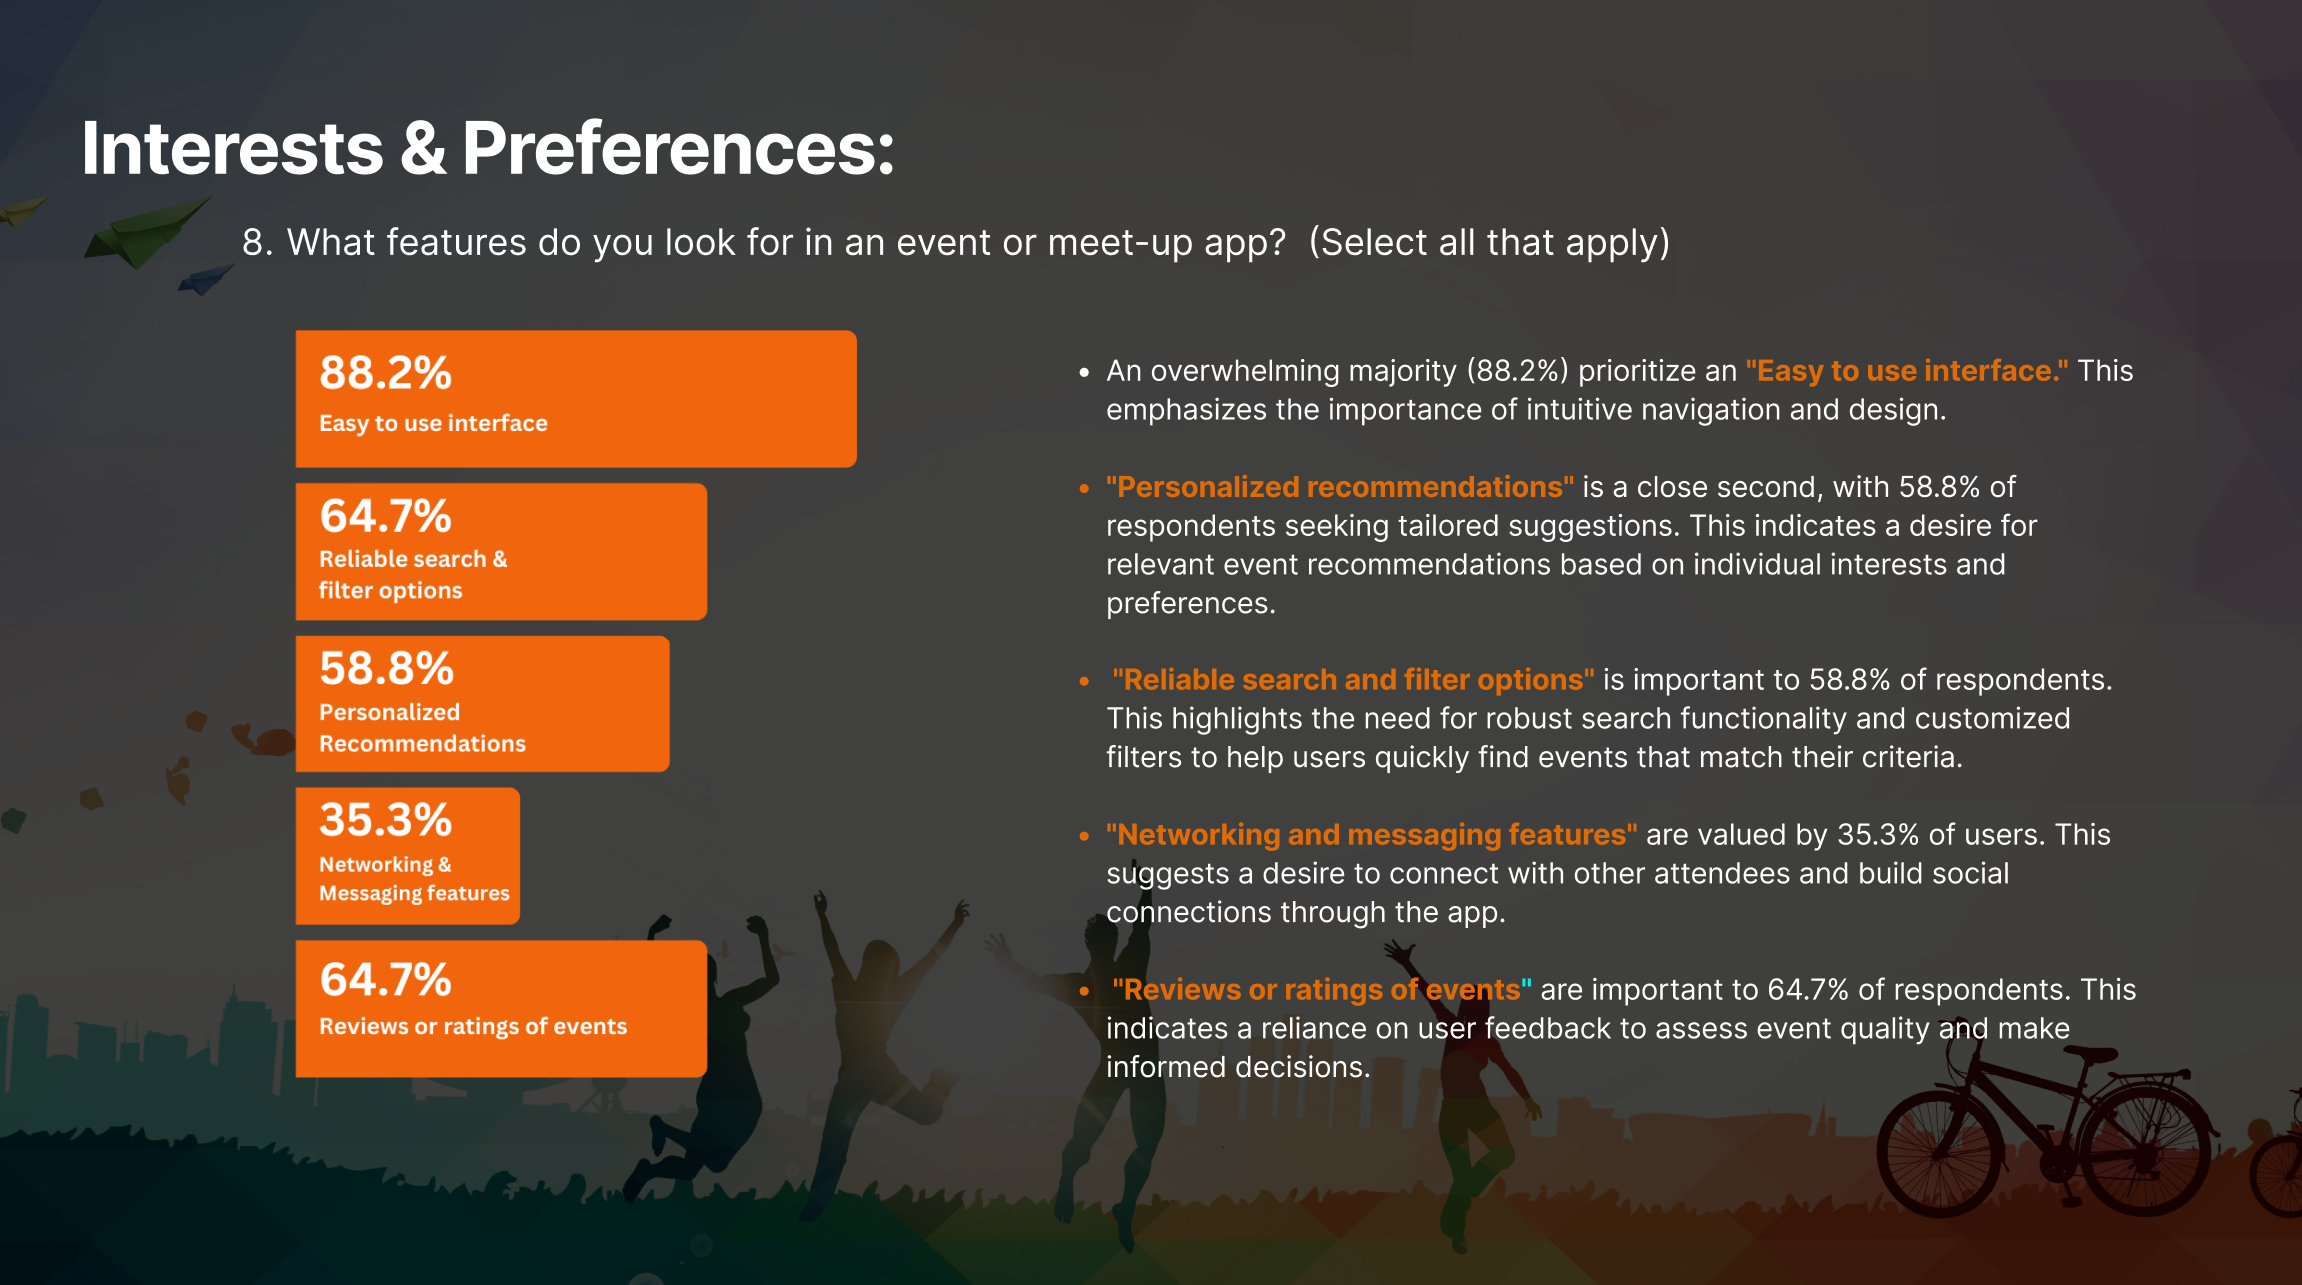
Simple, intuitive UI is essential
Nearby events are a top priority
Personalized recommendations increase engagement
Cost and clear pricing influence decisions
Social media is key for event discovery
Reviews and ratings build trust
App should support diverse user needs
Flexible schedules and detailed event info are valued
Recommendations
Offer diverse activities for young adults, parents, and seniors
Recommend events based on interests, behavior, and social links
Aggregate events into one discovery platform
Use maps and location-based filters
Highlight group, couple, and family friendly events
Enable filters for price, group type, and schedule
Support social sharing and friend activity visibility
Include ratings and reviews for trust
Show clear details on age range, pricing, and atmosphere
Promote free and budget-friendly events


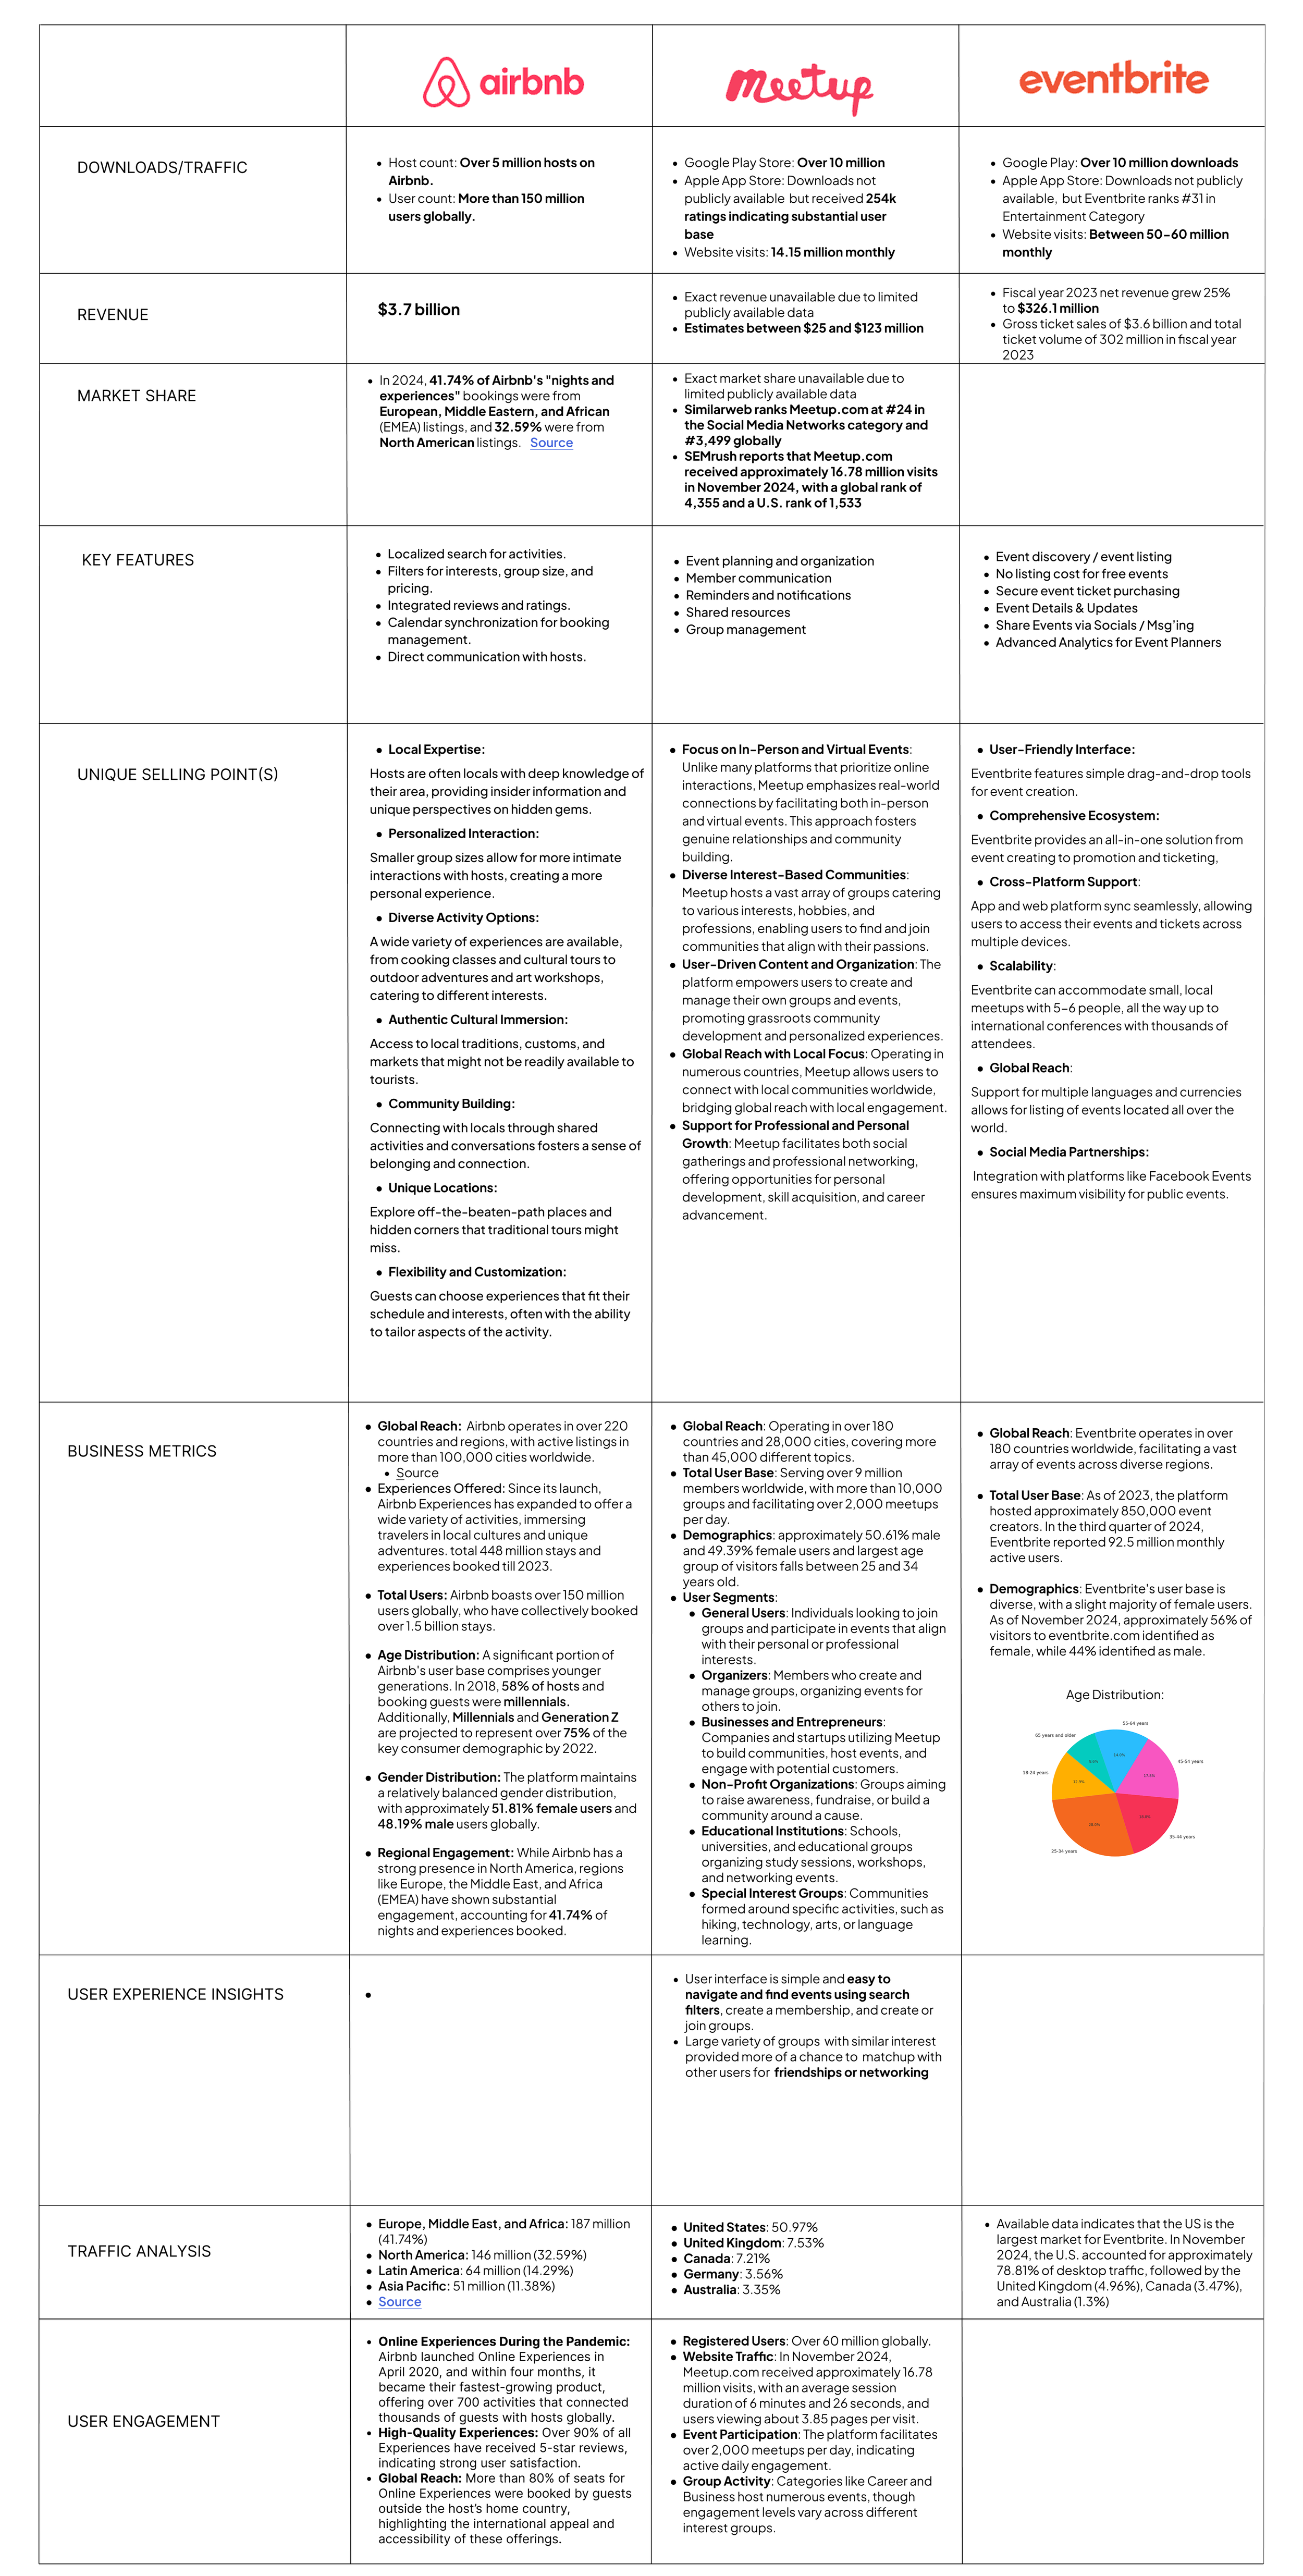
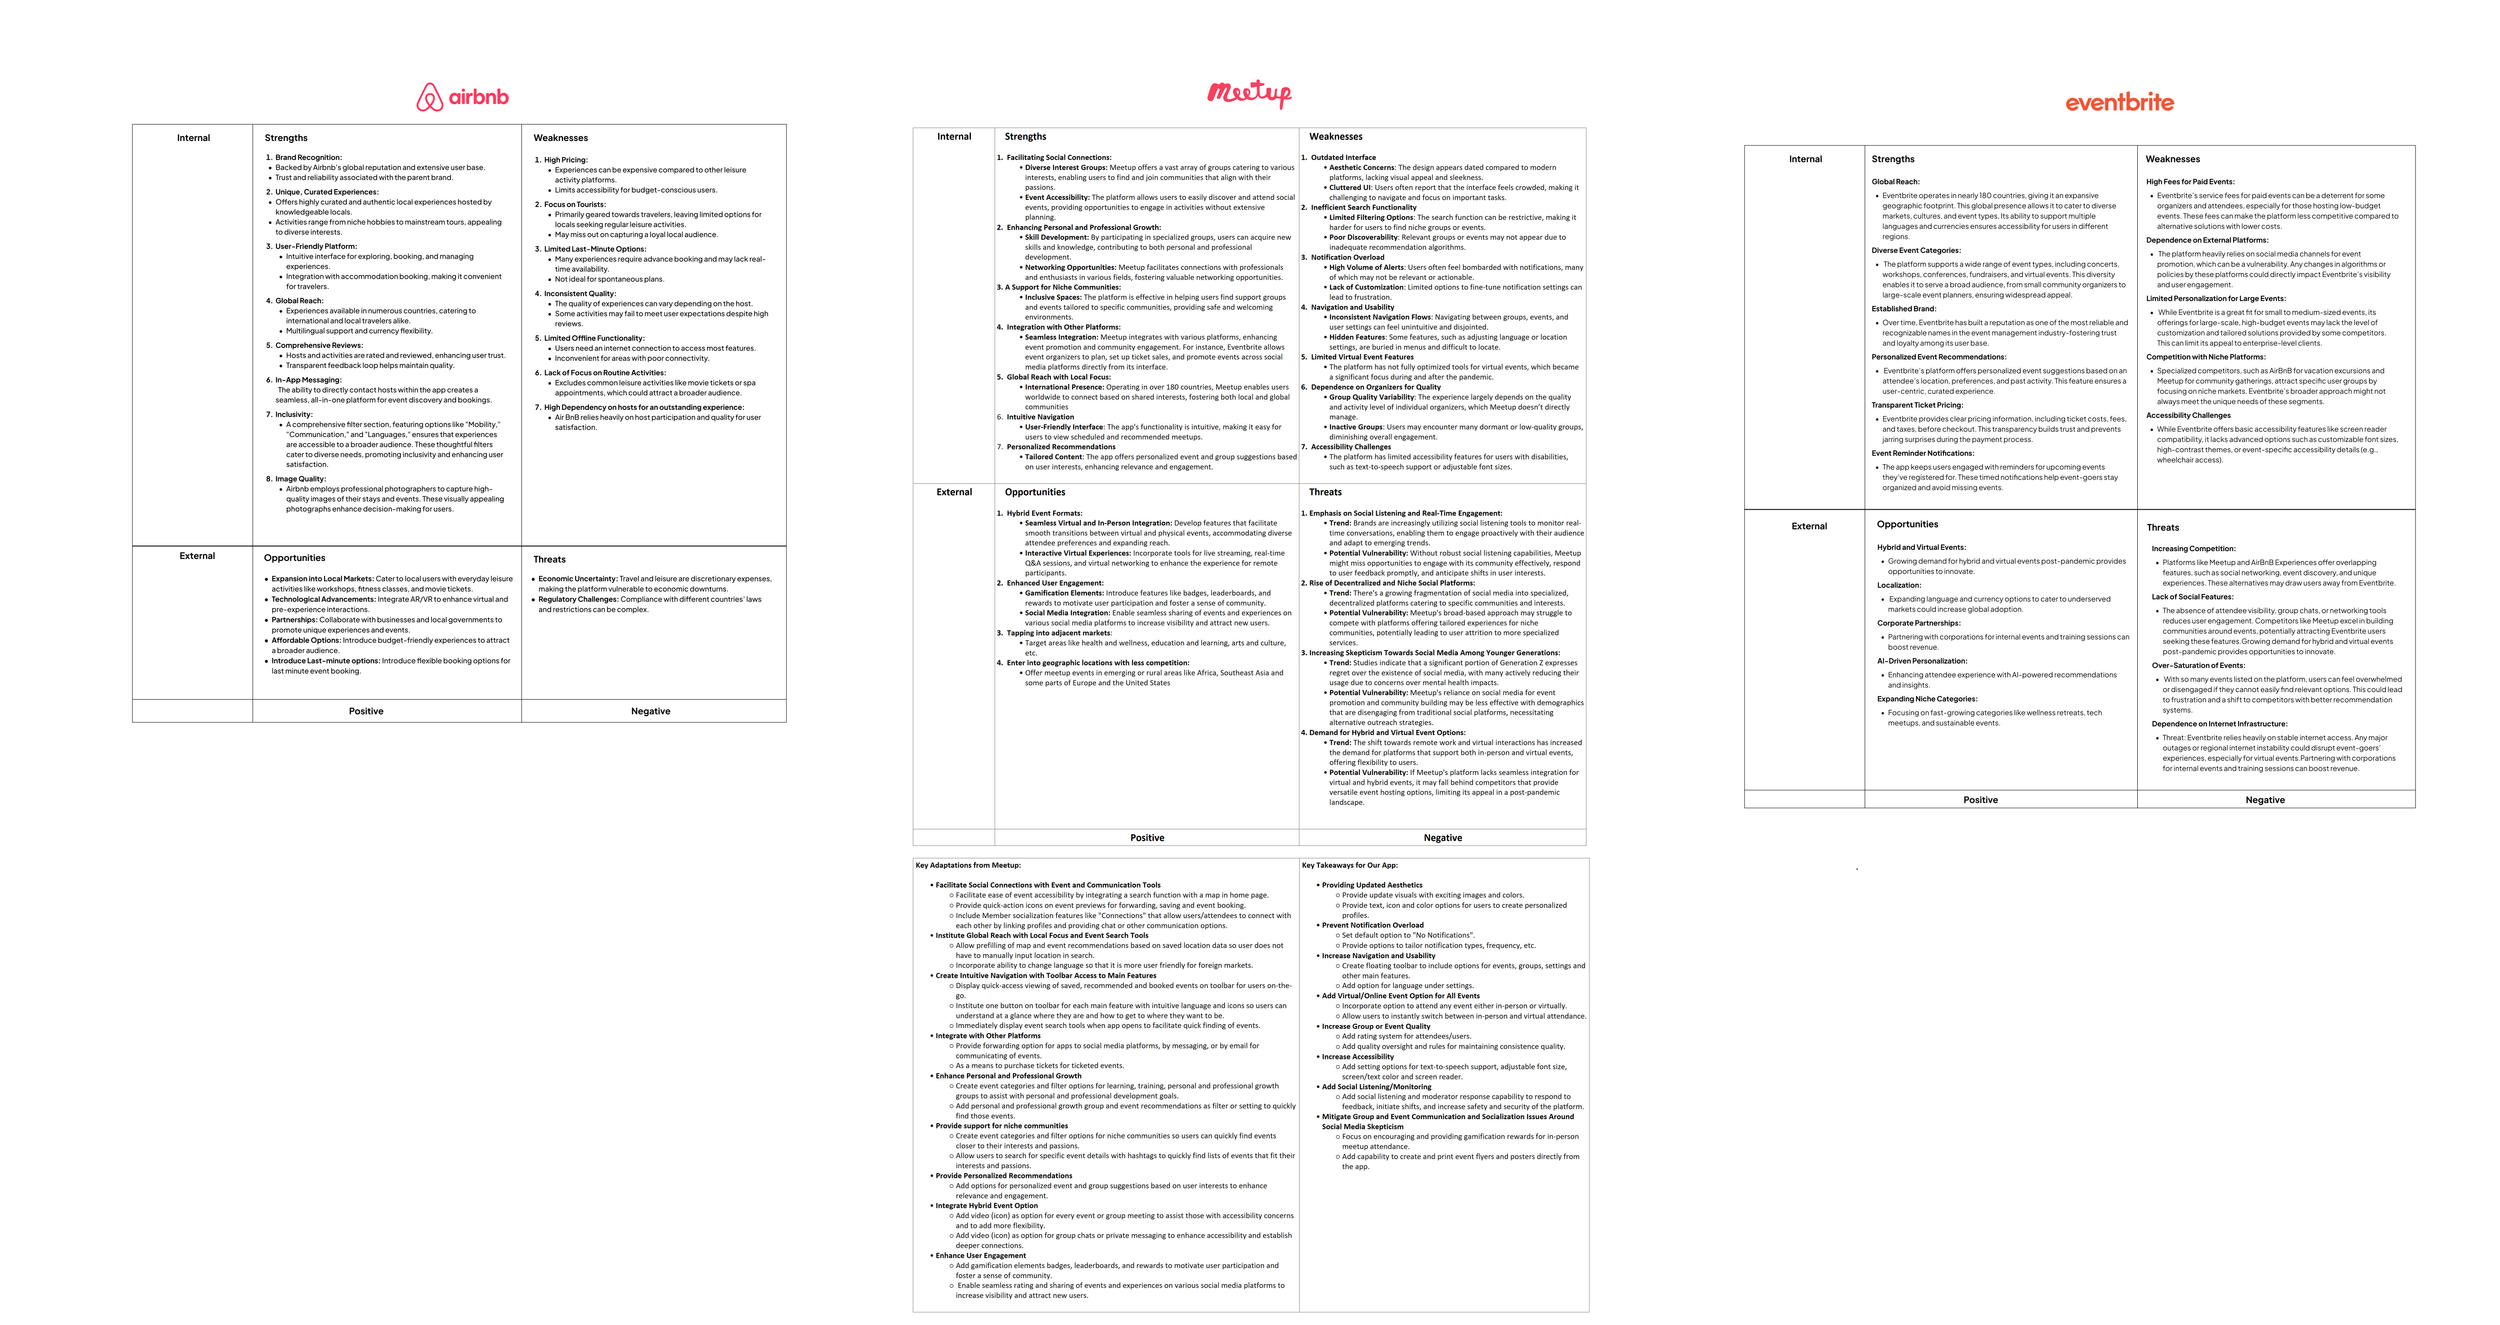
Competitive Analysis, SWOT Analysis, and SEO Analysis
SEO Analysis: Figma Link
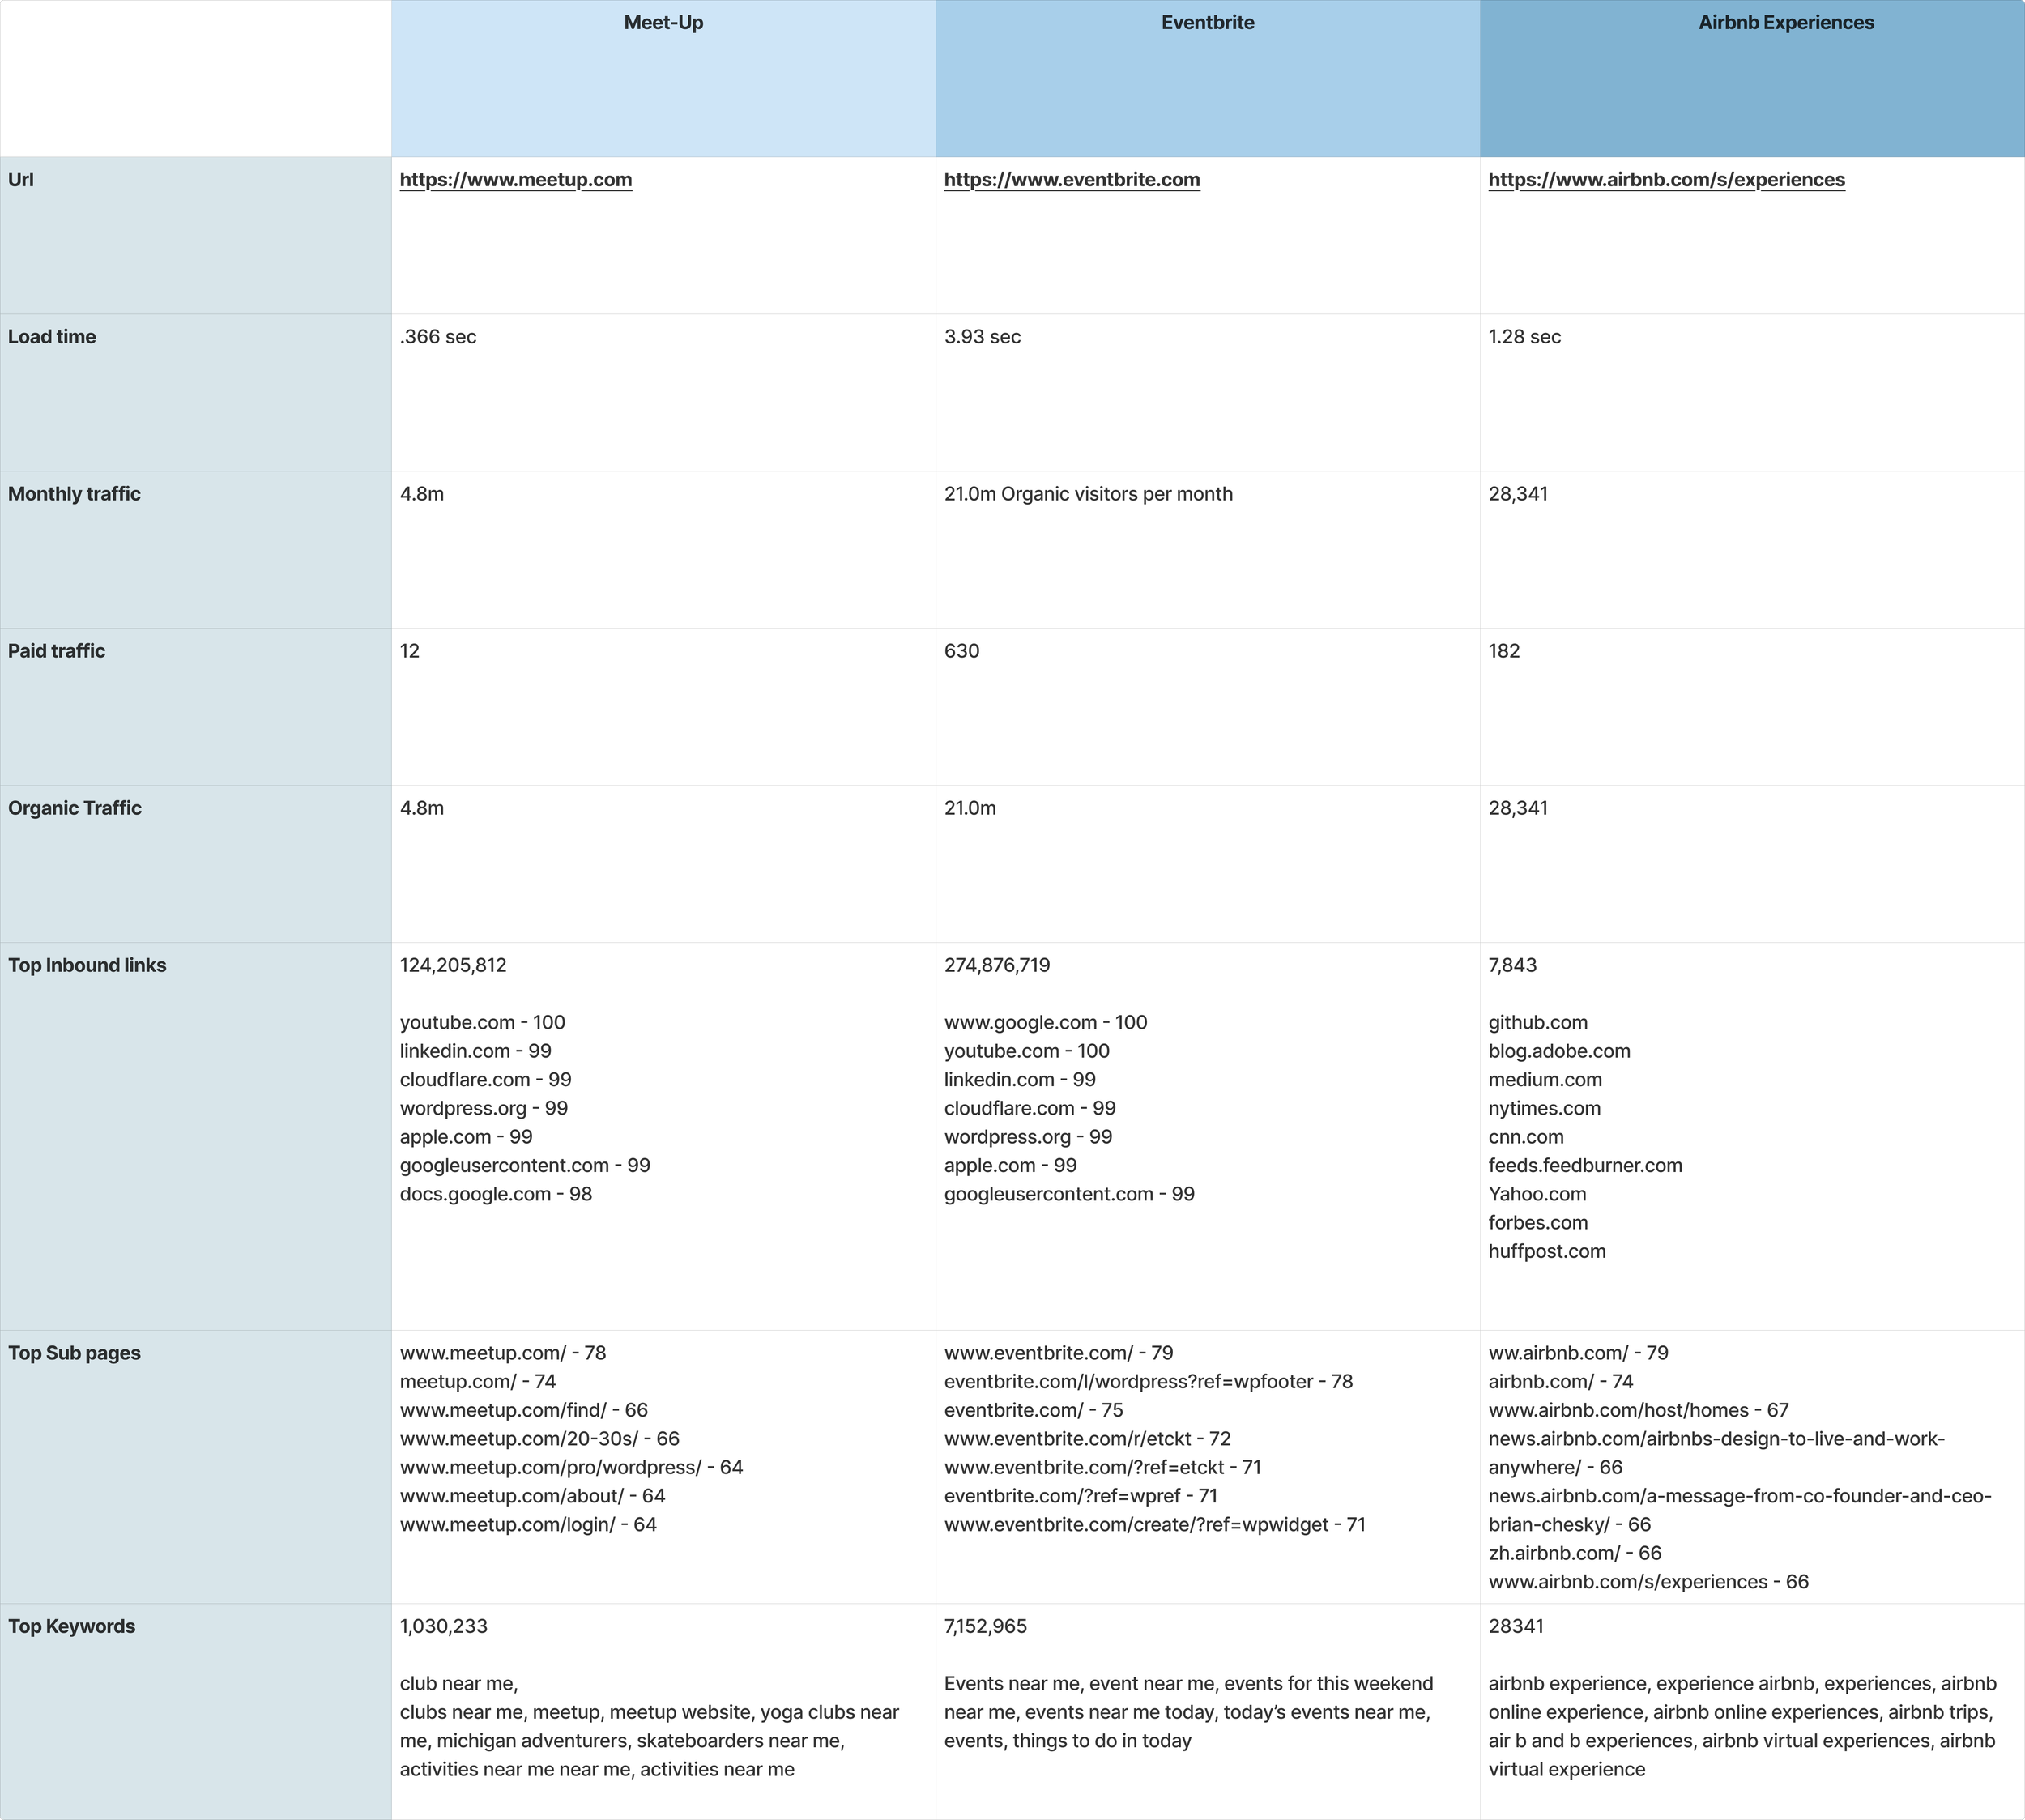
Competitive Analysis: Figma Link
SEO Analysis: Figma Link
Data Visualization
Leveraging Outdoor Recreation Trends for Leisure App Design
Outdoor recreation plays a major role in the U.S. economy, encompassing activities such as hiking, camping, festivals, and transportation services. This case study uses data from the U.S. Bureau of Economic Analysis (BEA), specifically the Outdoor Recreation Satellite Account (ORSA), to analyze industry trends and identify opportunities for leisure apps to align with changing consumer preferences.
Source of Data:
The U.S. Bureau of Economic Analysis (BEA)
https://www.bea.gov/data/special-topics/outdoor-recreation
Analysis of Popular Activities in the Last Five Years (2019–2023)
I also created a data visualization to illustrate the trends in various outdoor activities by category from 2019 to 2023. This chart provides a clearer understanding of shifts and patterns in outdoor activities over the last few years.

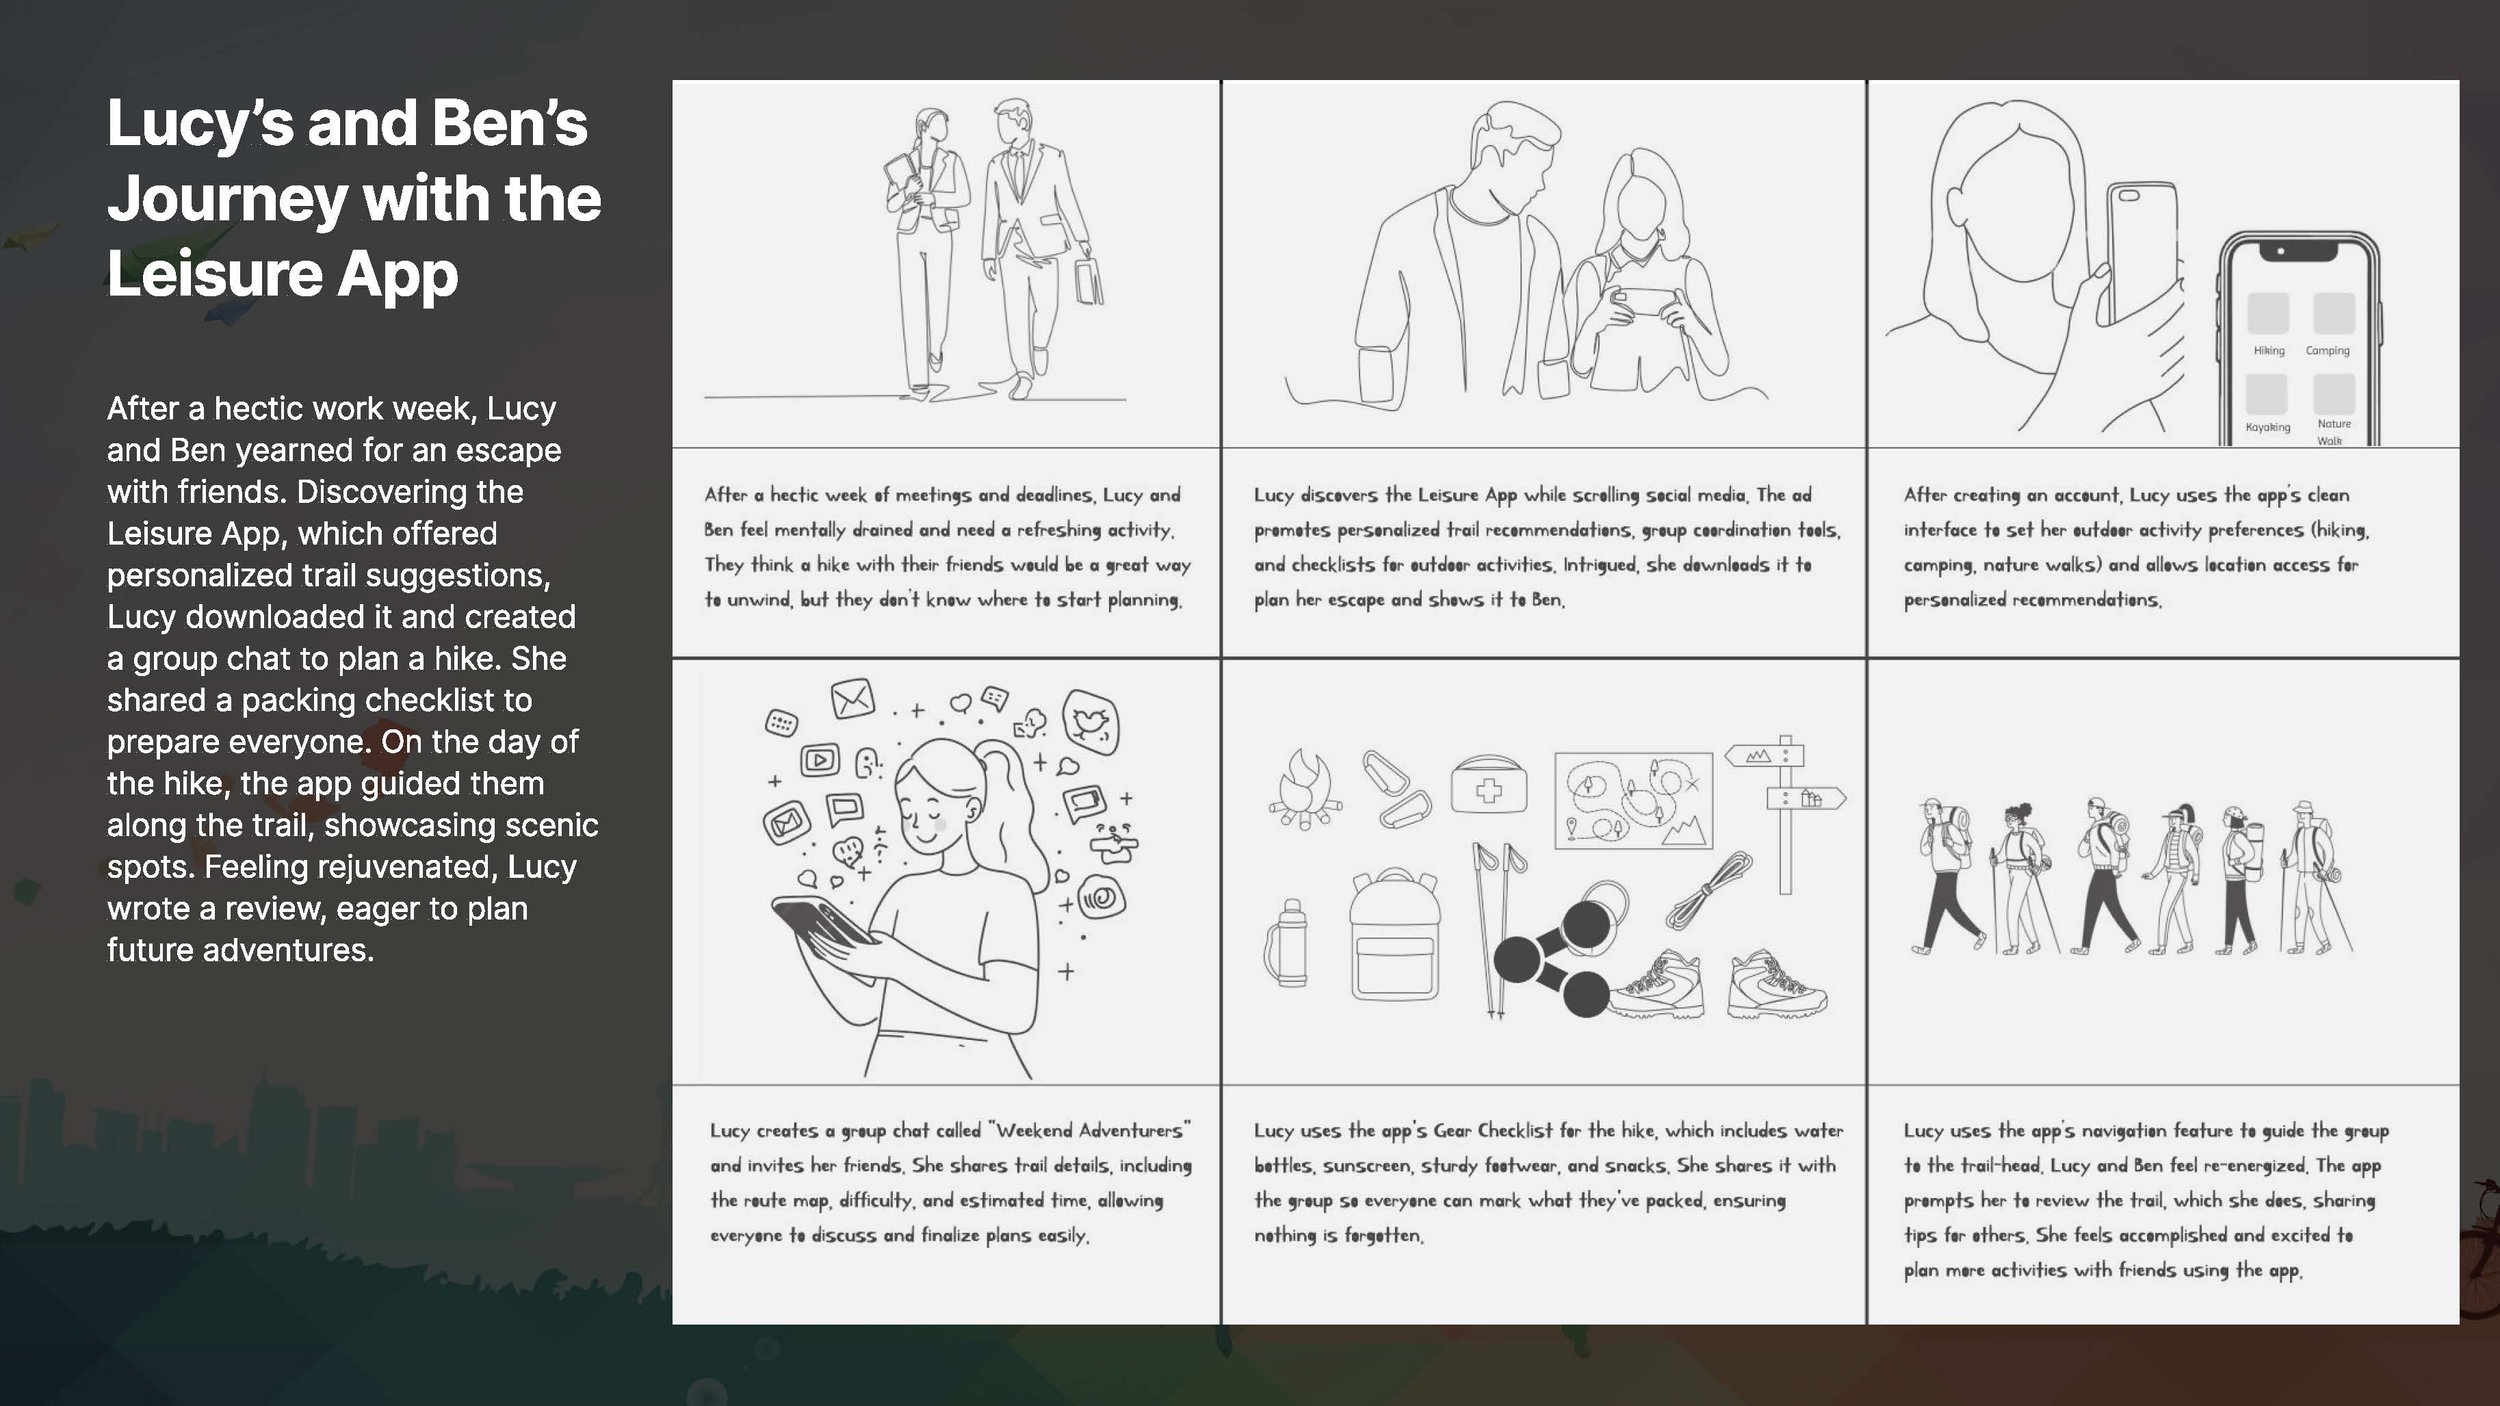
User Personas, User Story, and Empathy Map
Based on the research insights, I created user personas, user stories, and empathy maps to represent our target users and keep their needs at the center of the design process. The personas captured key goals, behaviors, and challenges, while user stories helped translate those needs into clear, actionable requirements. Empathy maps allowed us to understand what users think, feel, say, and do, ensuring the experience was designed with empathy, clarity, and real user motivations in mind.


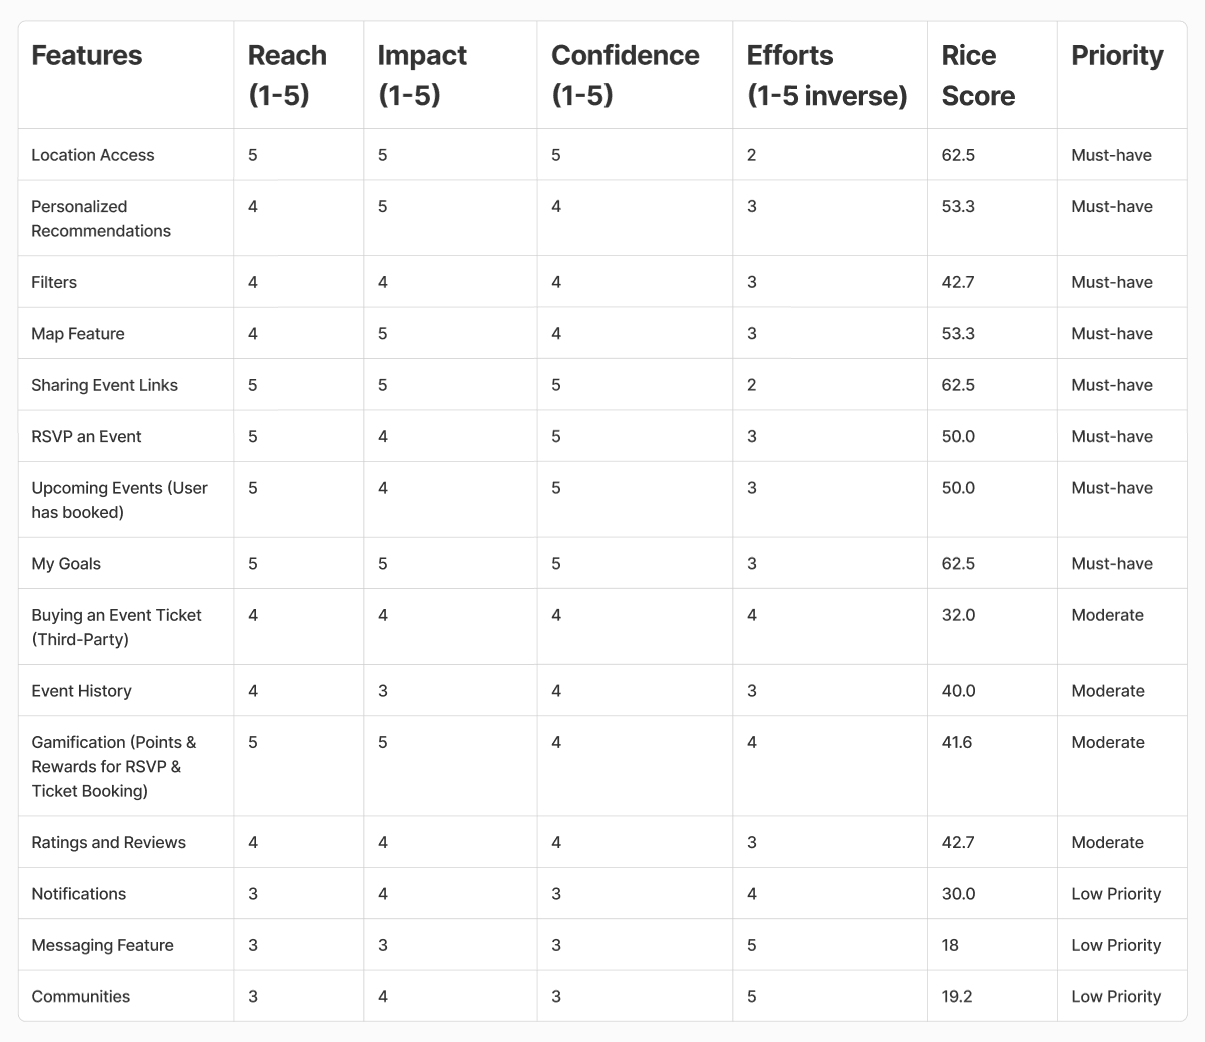
MVP | RICE Framework | User Flows
For the initial launch of BUTTERFLY, we focused on delivering an intuitive, compelling, and streamlined event discovery experience through a mobile-first approach. The MVP includes essential features that allow users to find, book, and attend events as well as establish and track goals seamlessly, with a foundation for future growth.
Final MVP Features:
Location Access – Enables event discovery near them.
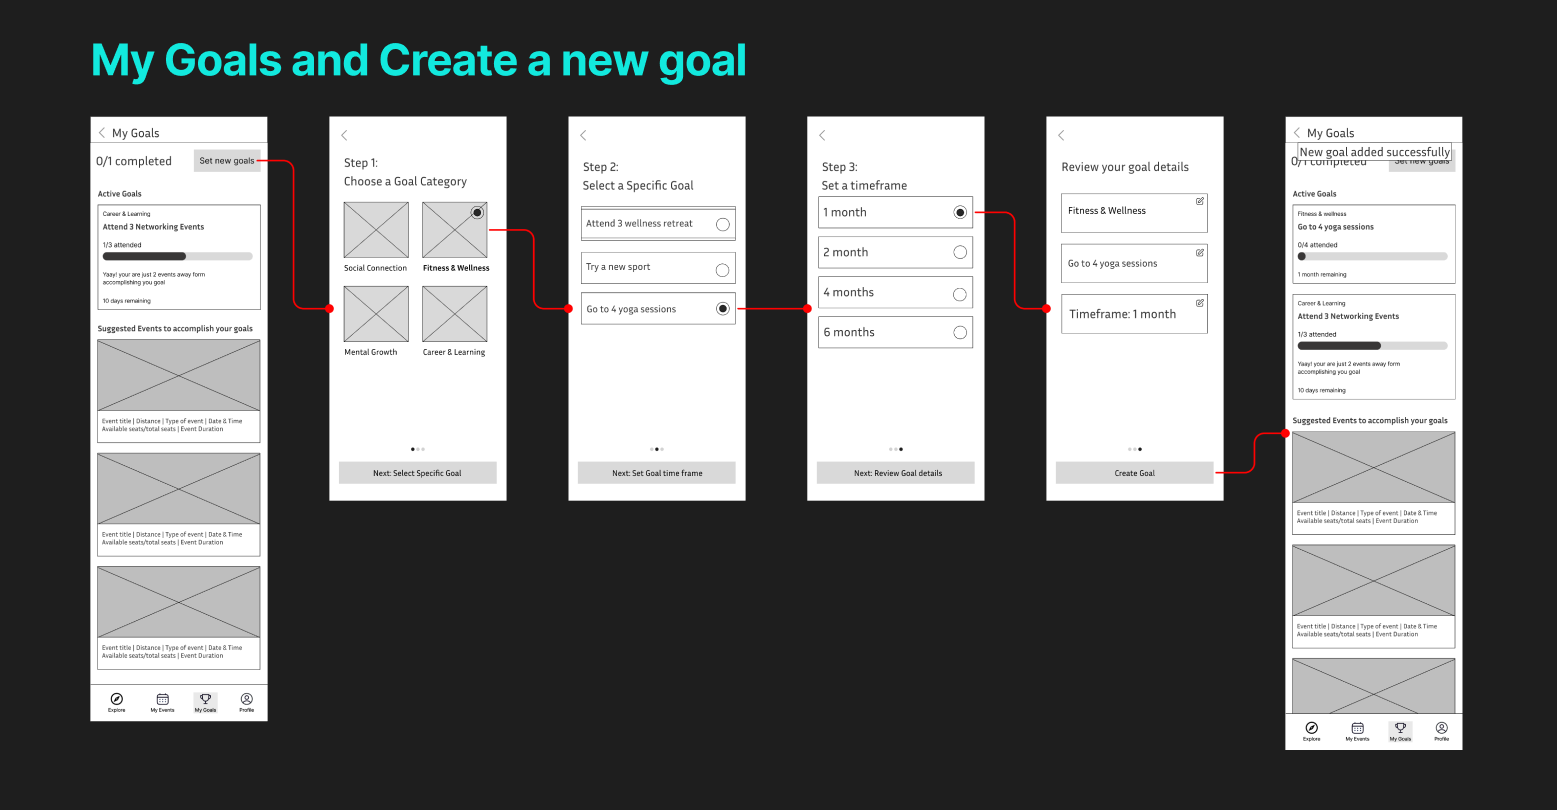
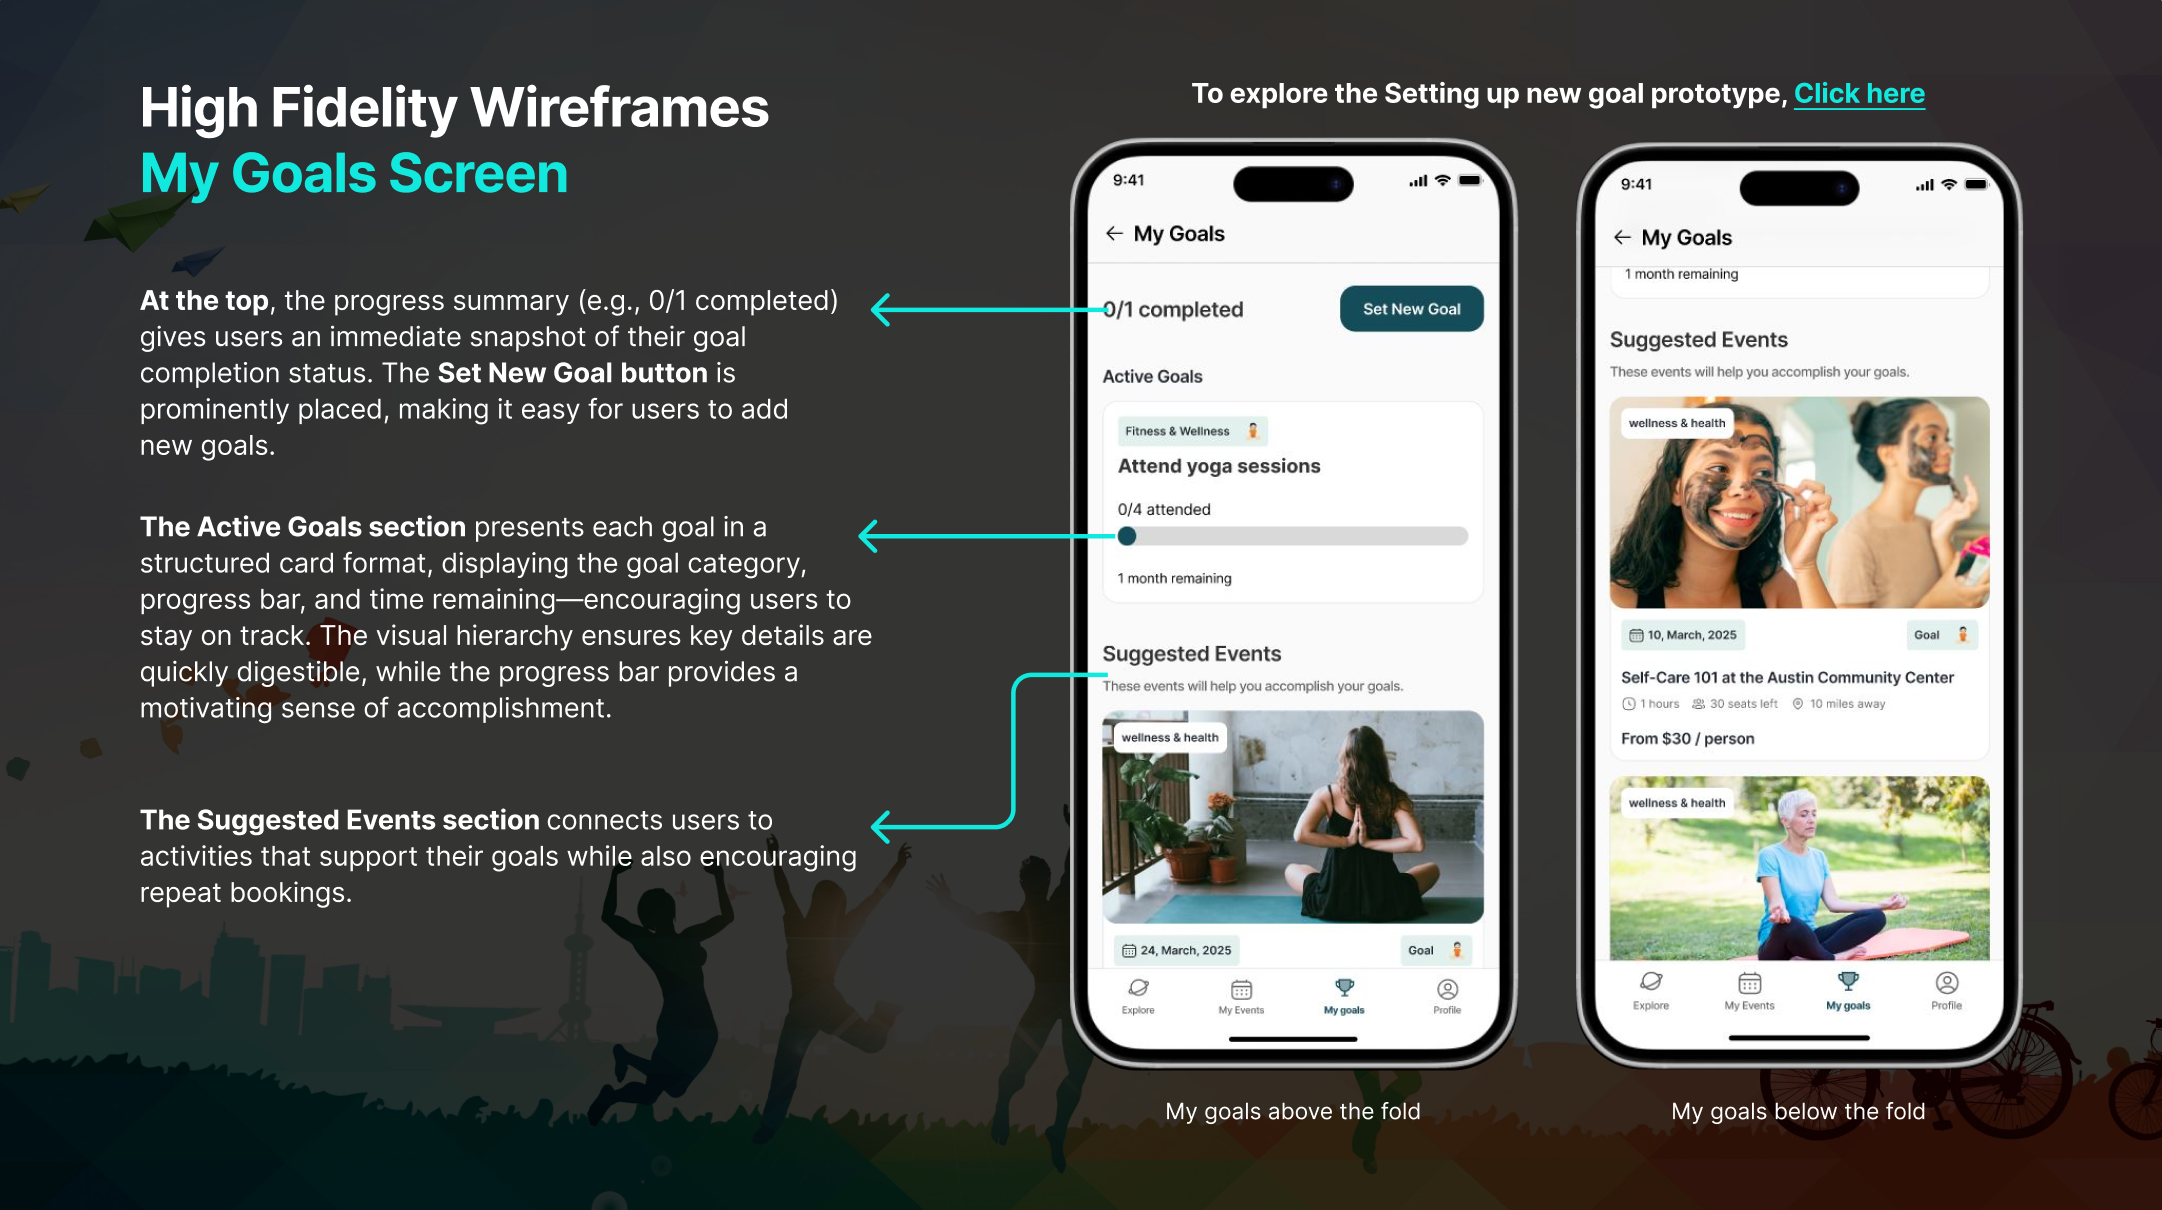
My Goals – Establish and track goals to enhance personalization and increase engagement.
Personalized Recommendations – Suggests events based on the user’s interests and goals.
Filters – Helps users refine searches.
Map Feature – Visual representation of event location.
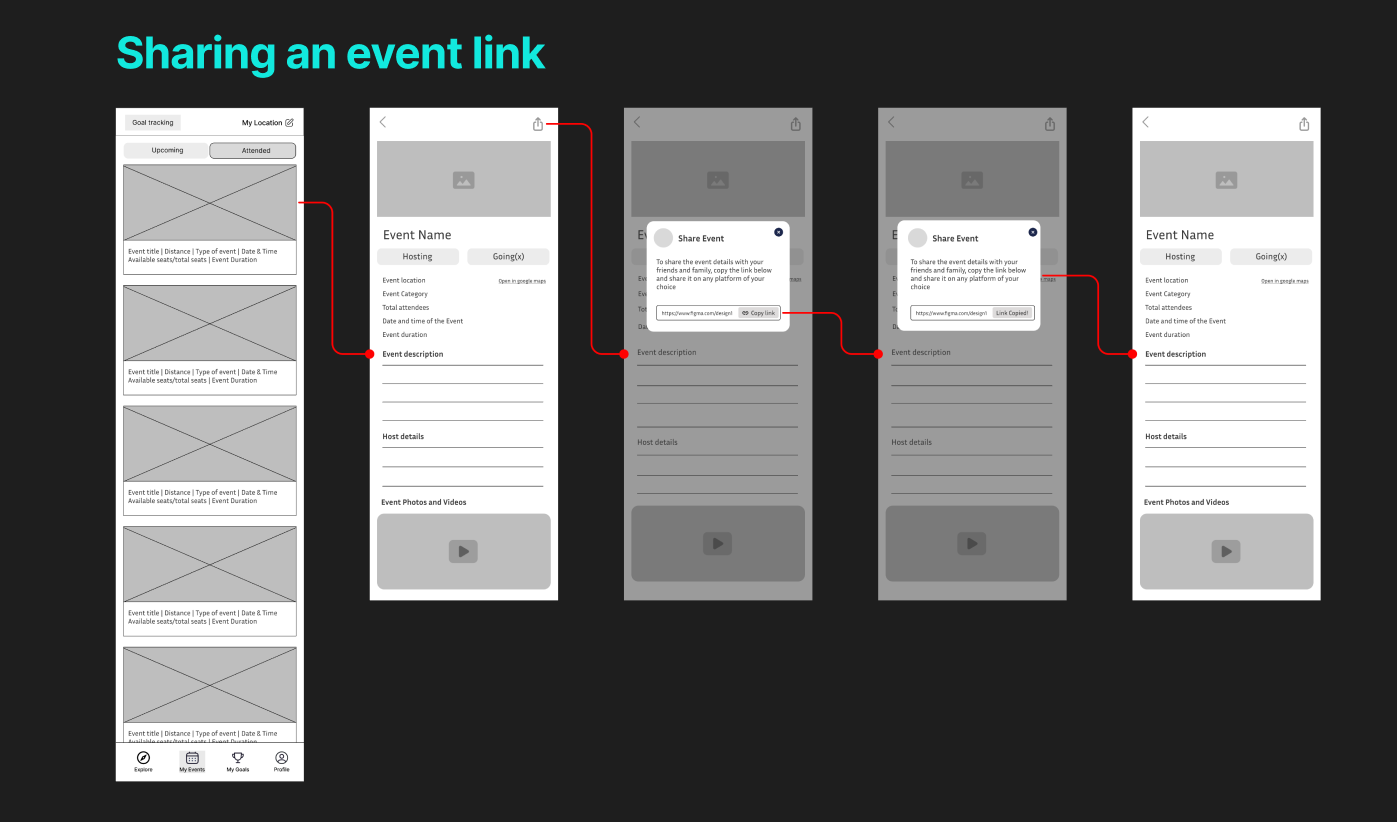
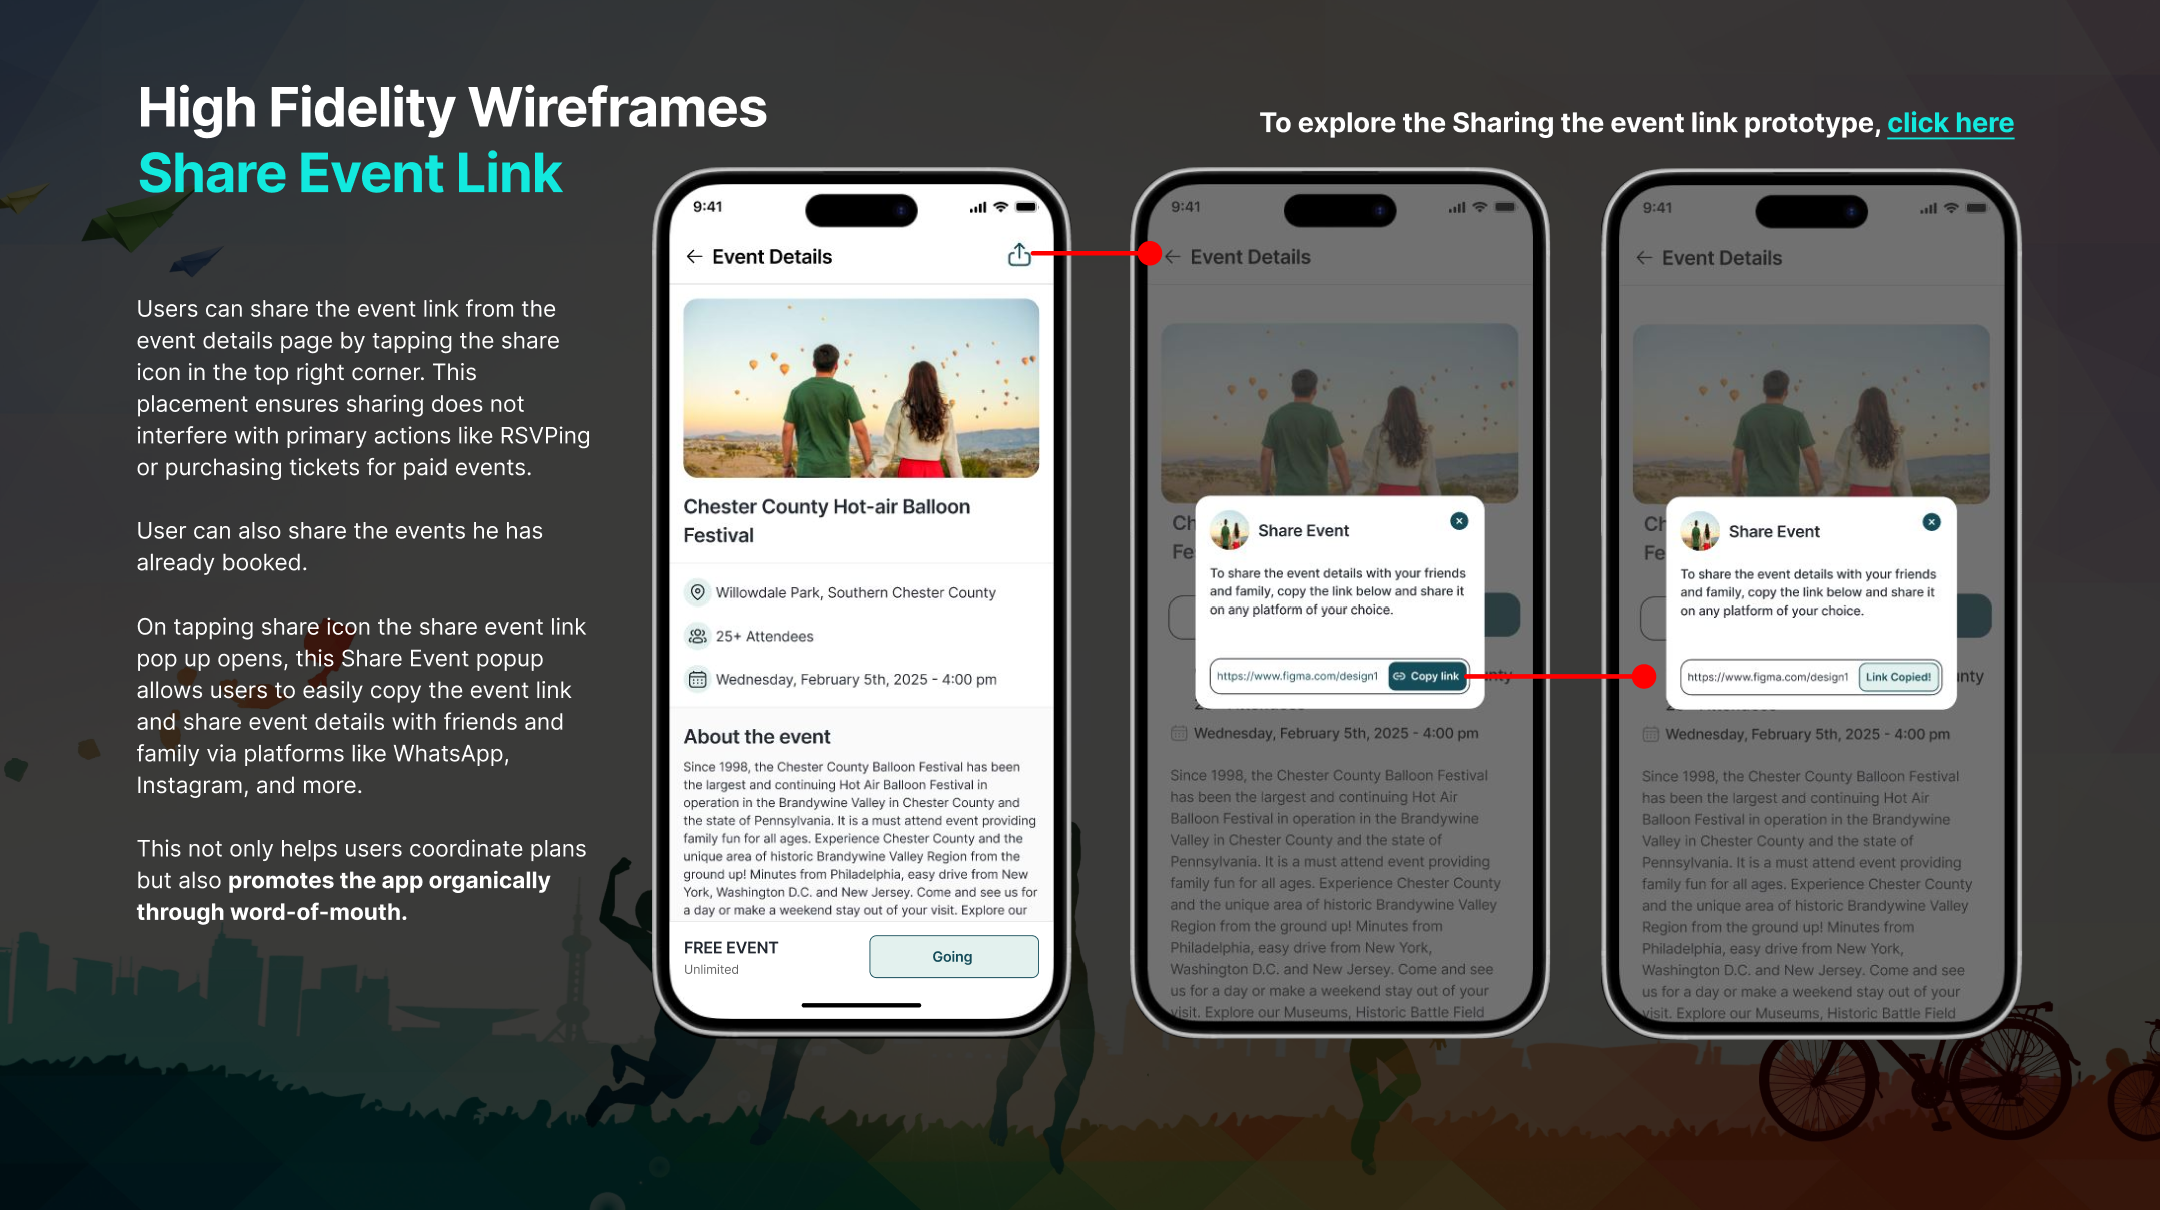
Sharing Event Links – Encourages social sharing and virality.
RSVP for an Event – Allows users to confirm attendance.
Upcoming Events (User has booked) – Helps users track event bookings.
Buying an Event Ticket (Third-Party) – Enables monetization but requires integration with an external API.
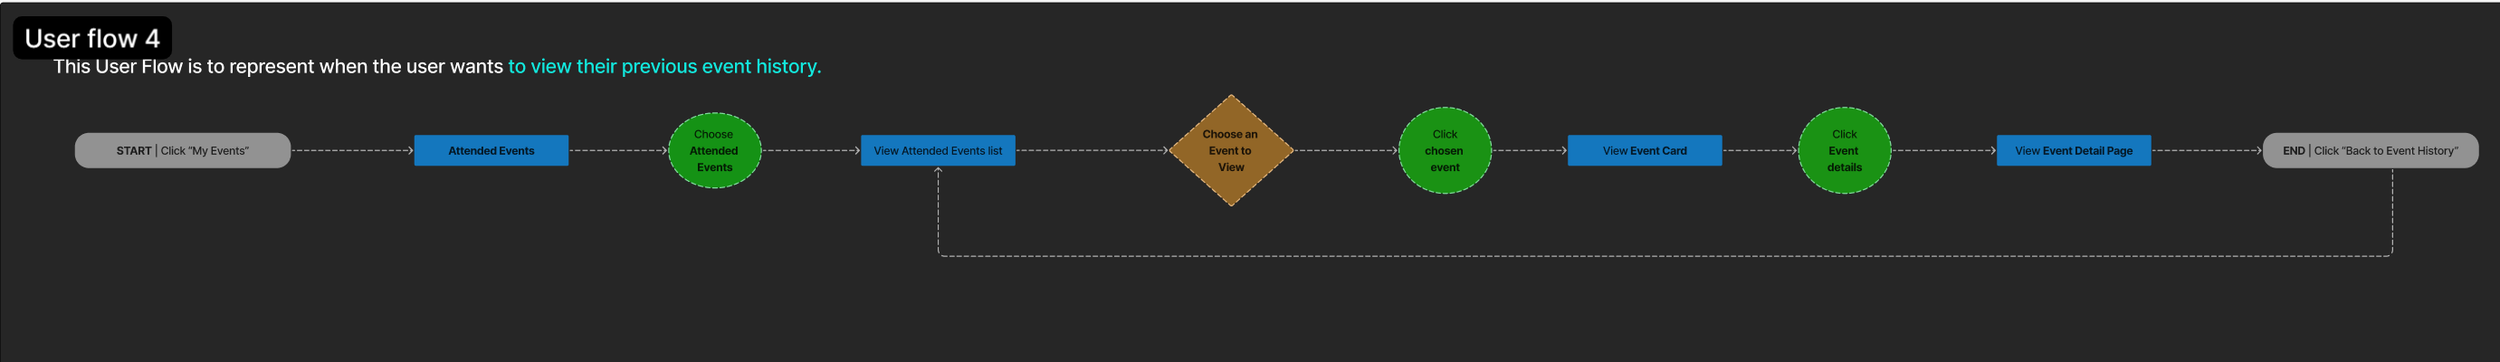
Event History – Helps users track past events.
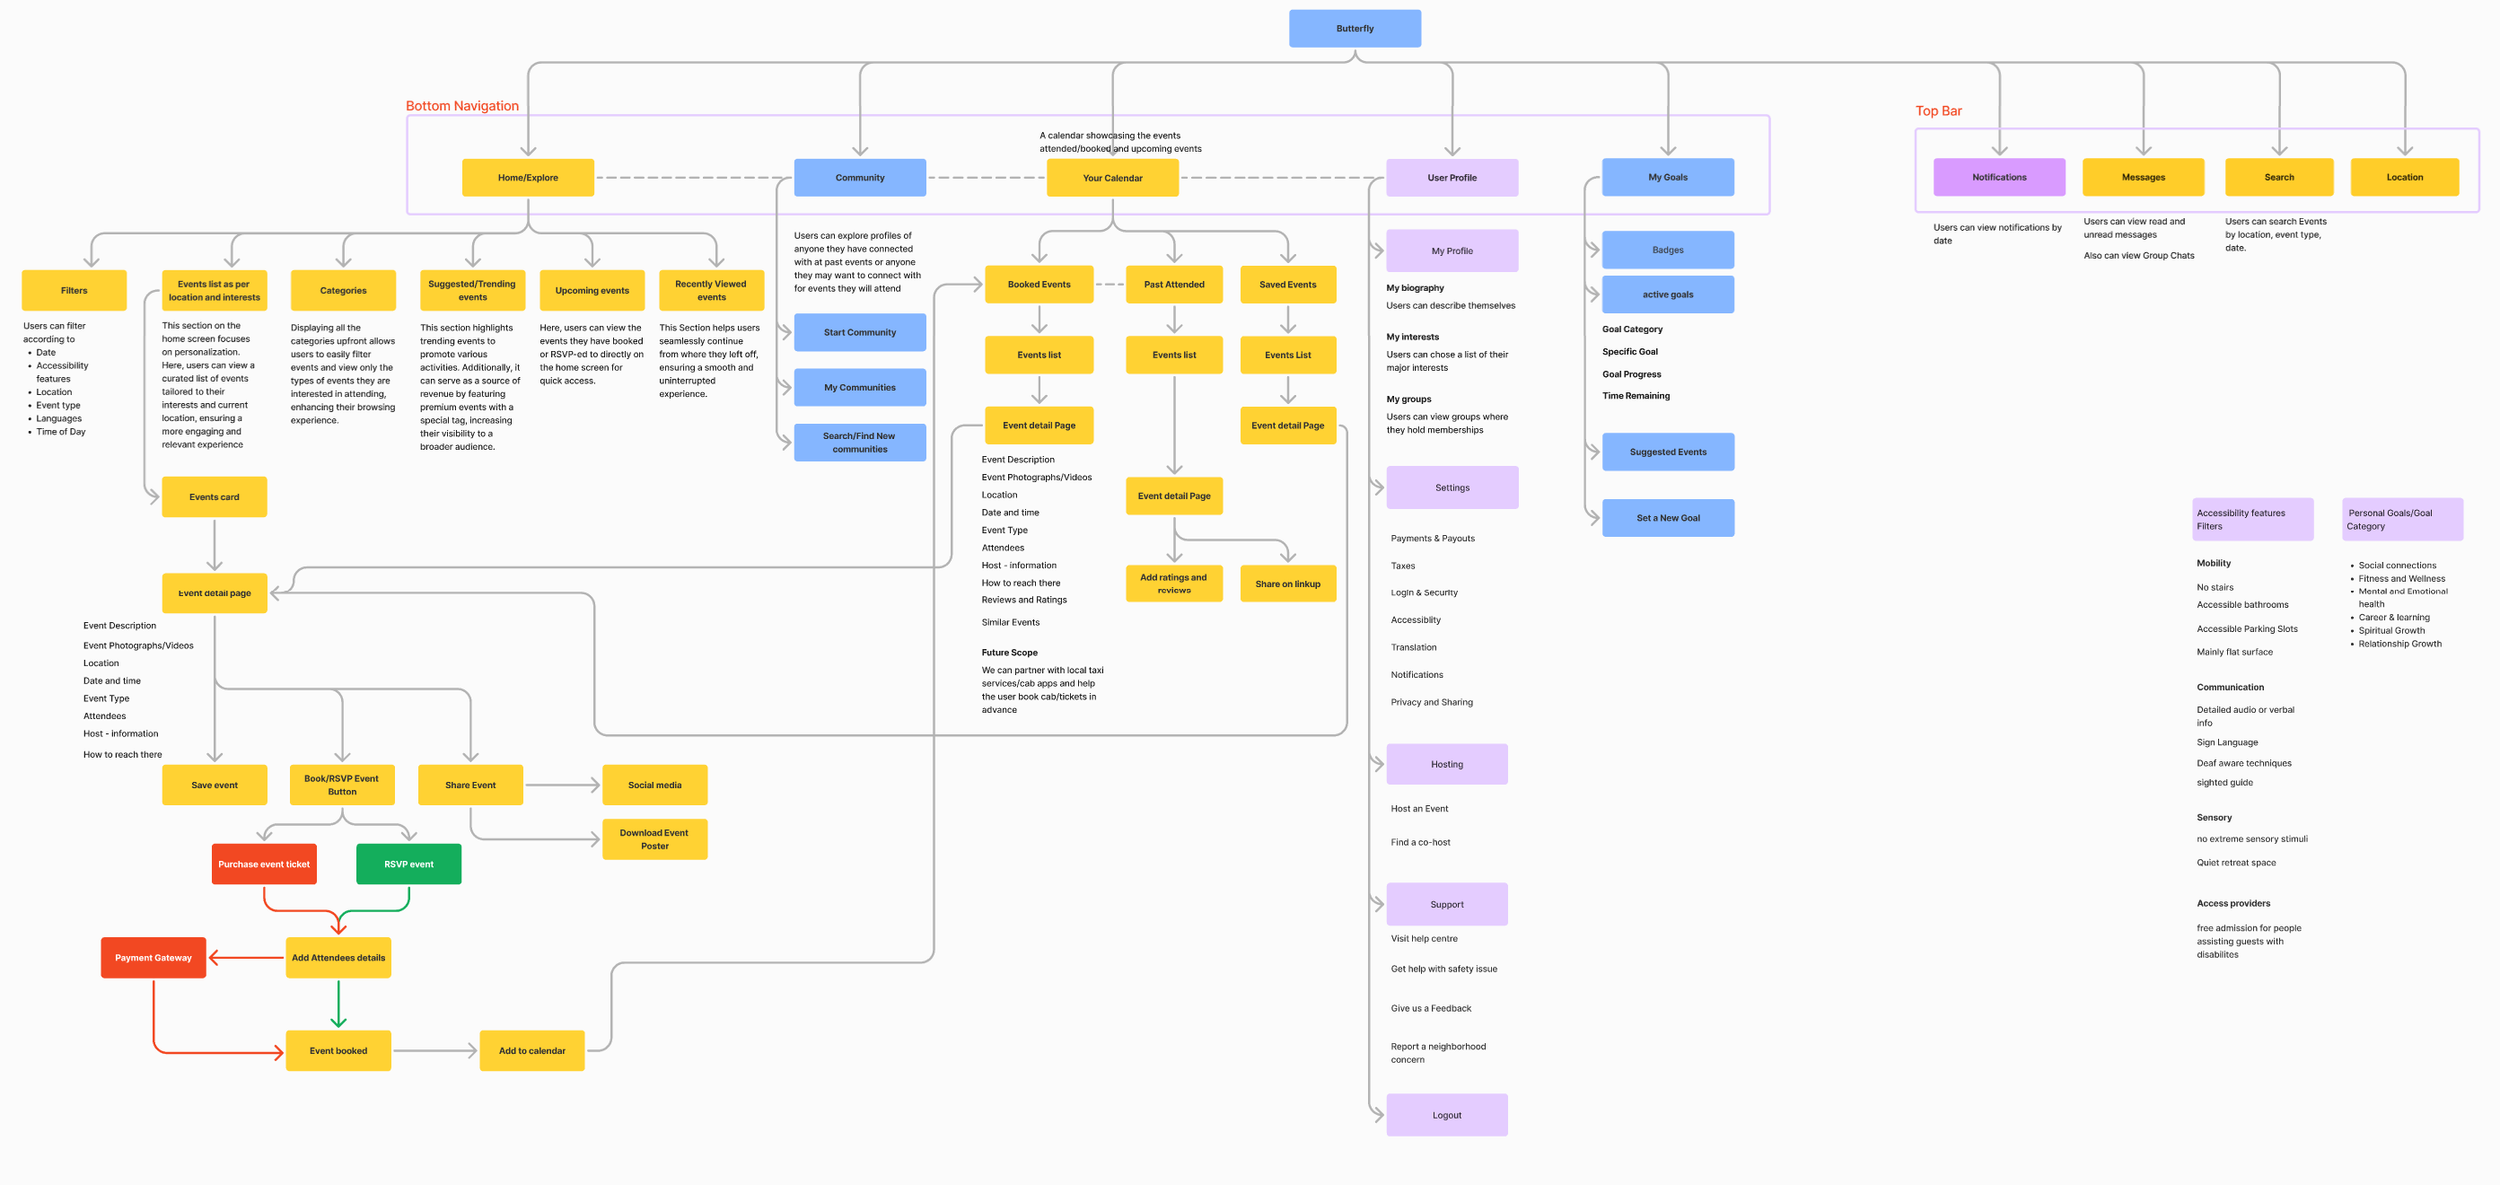
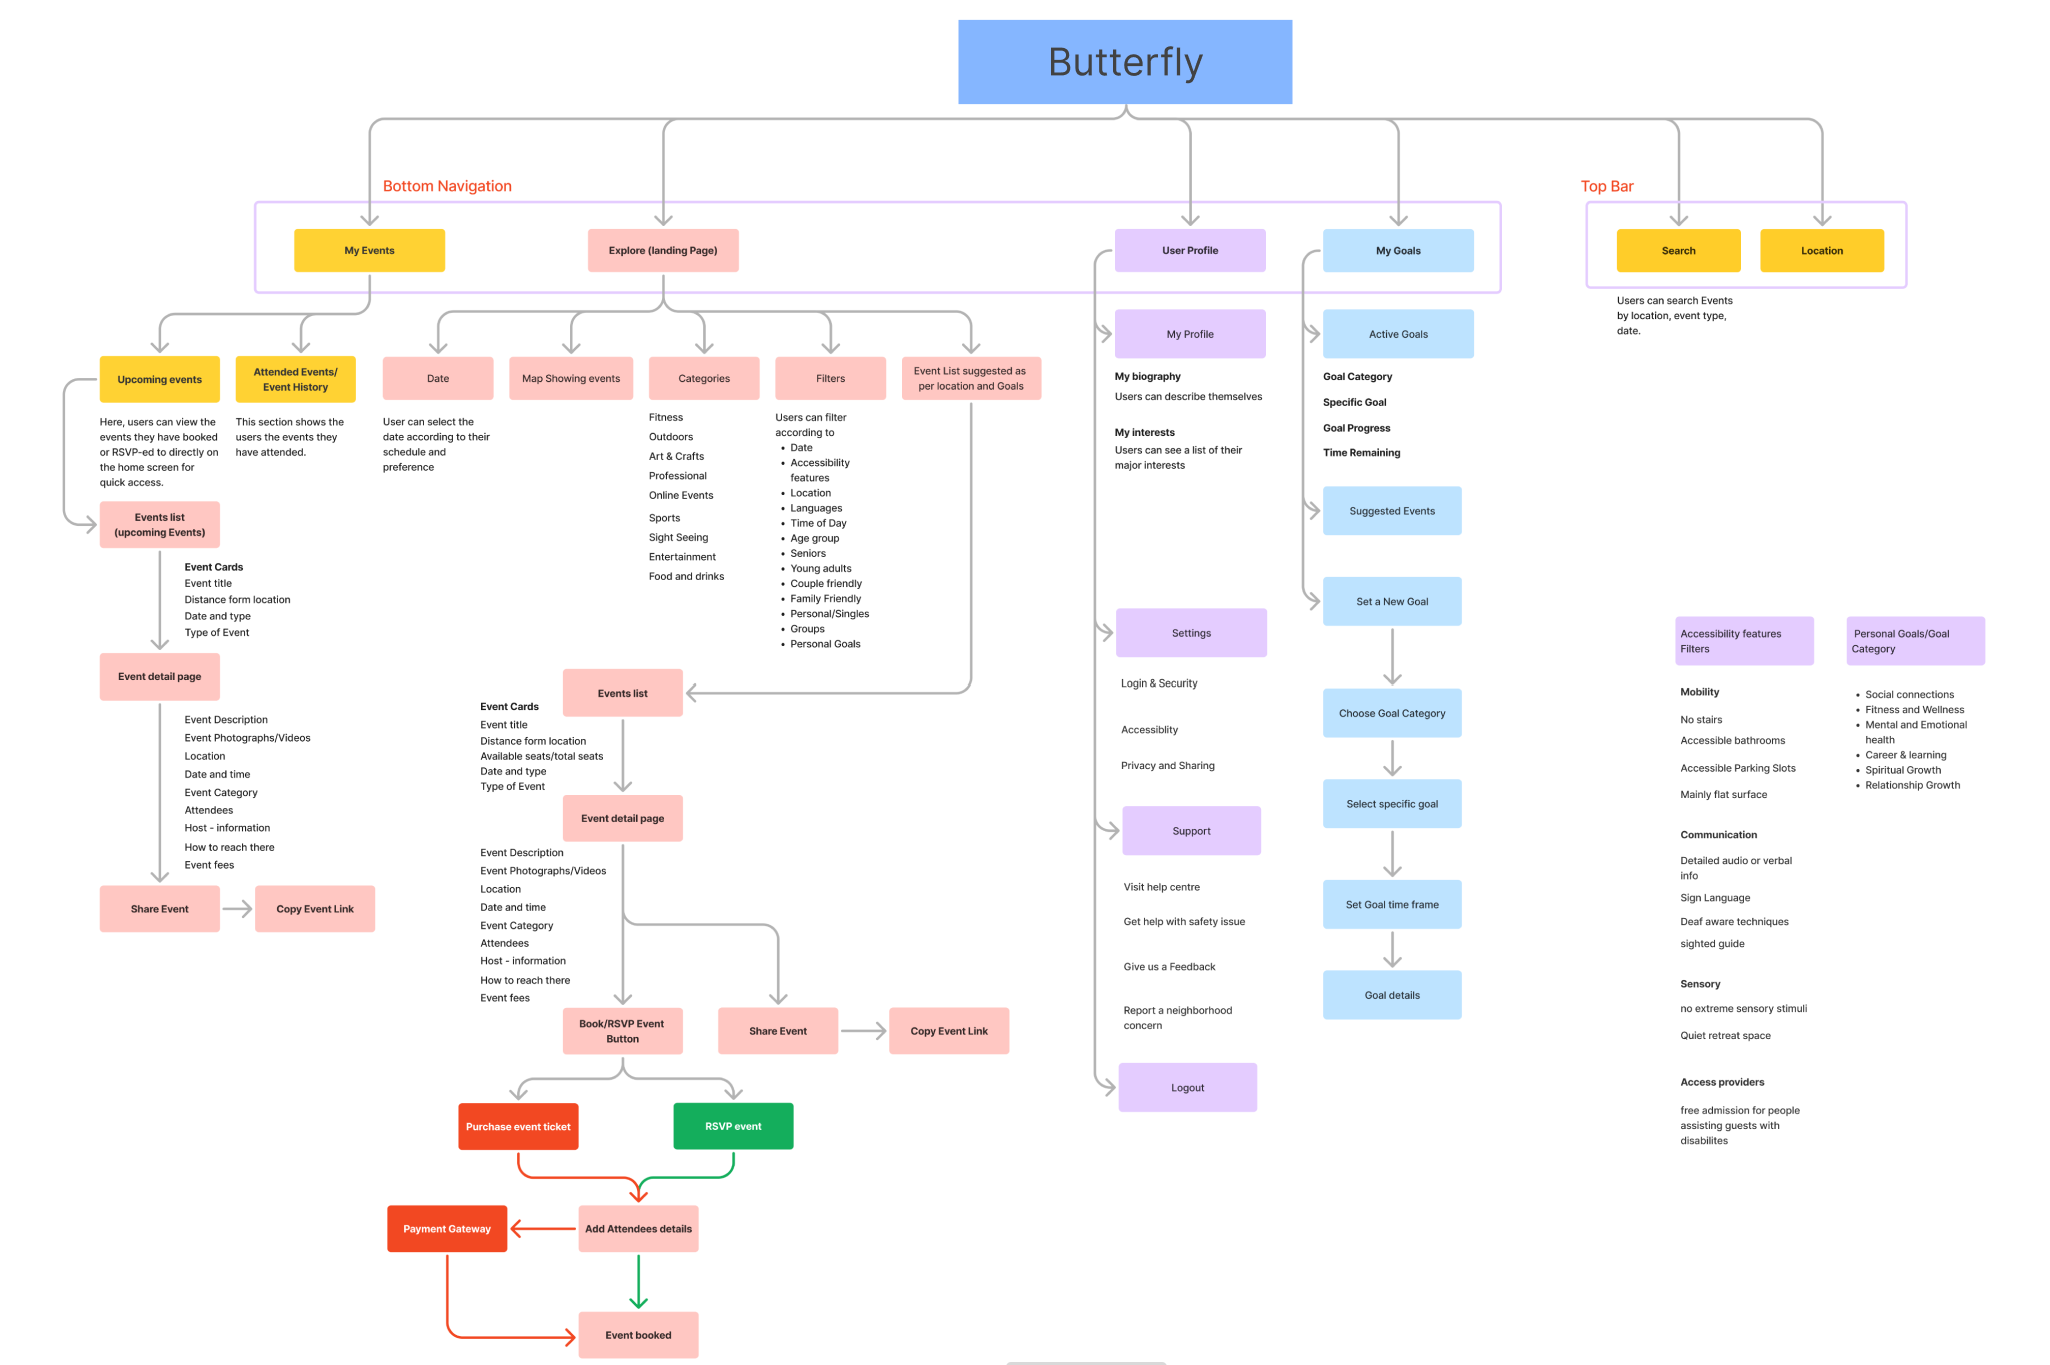
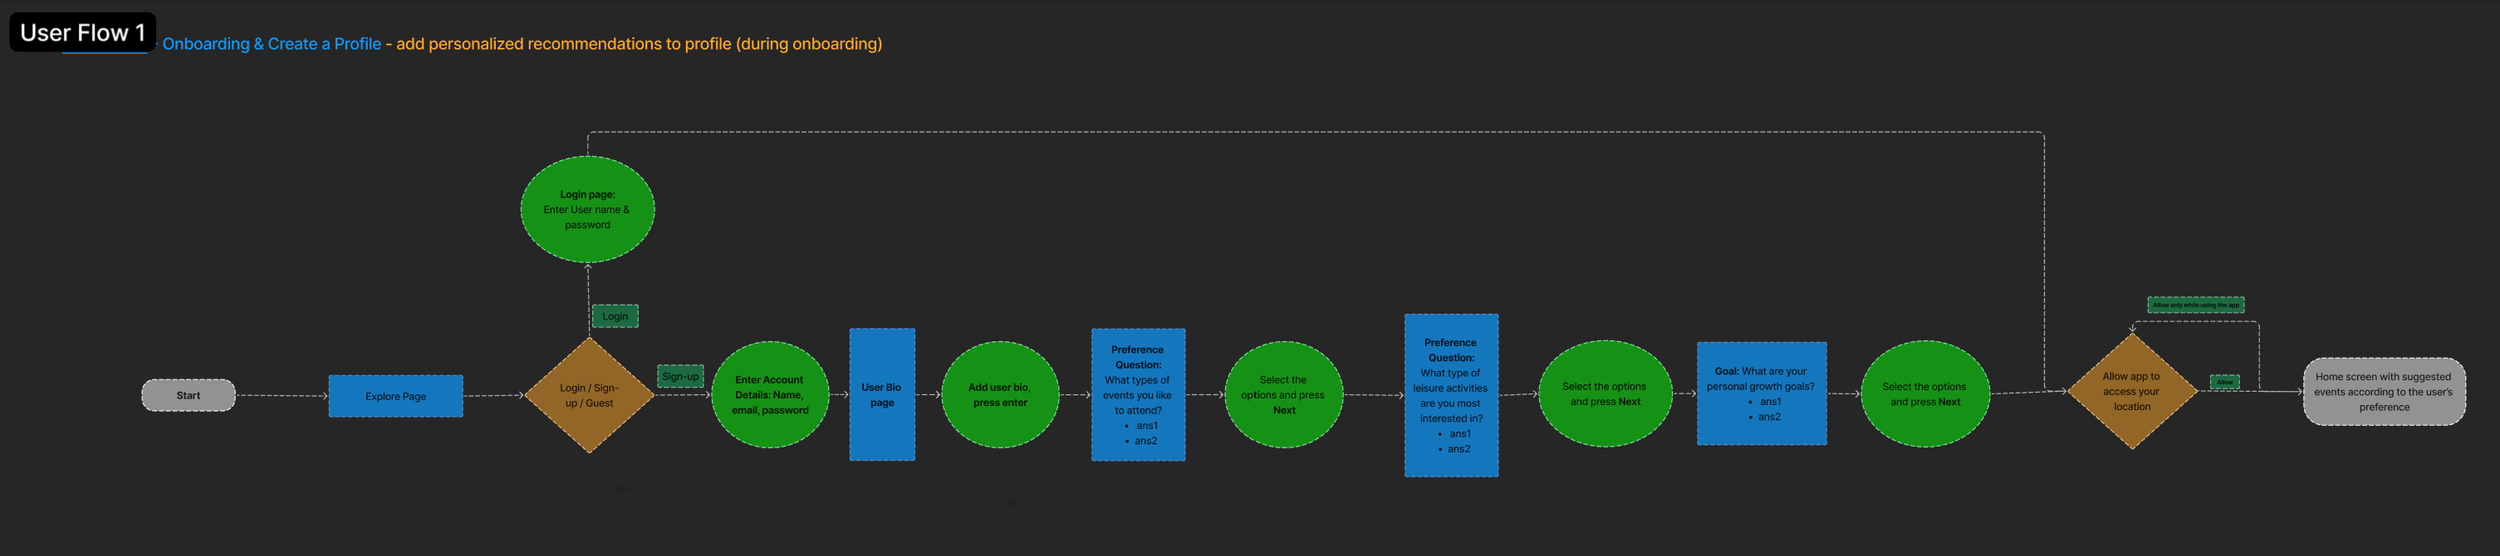
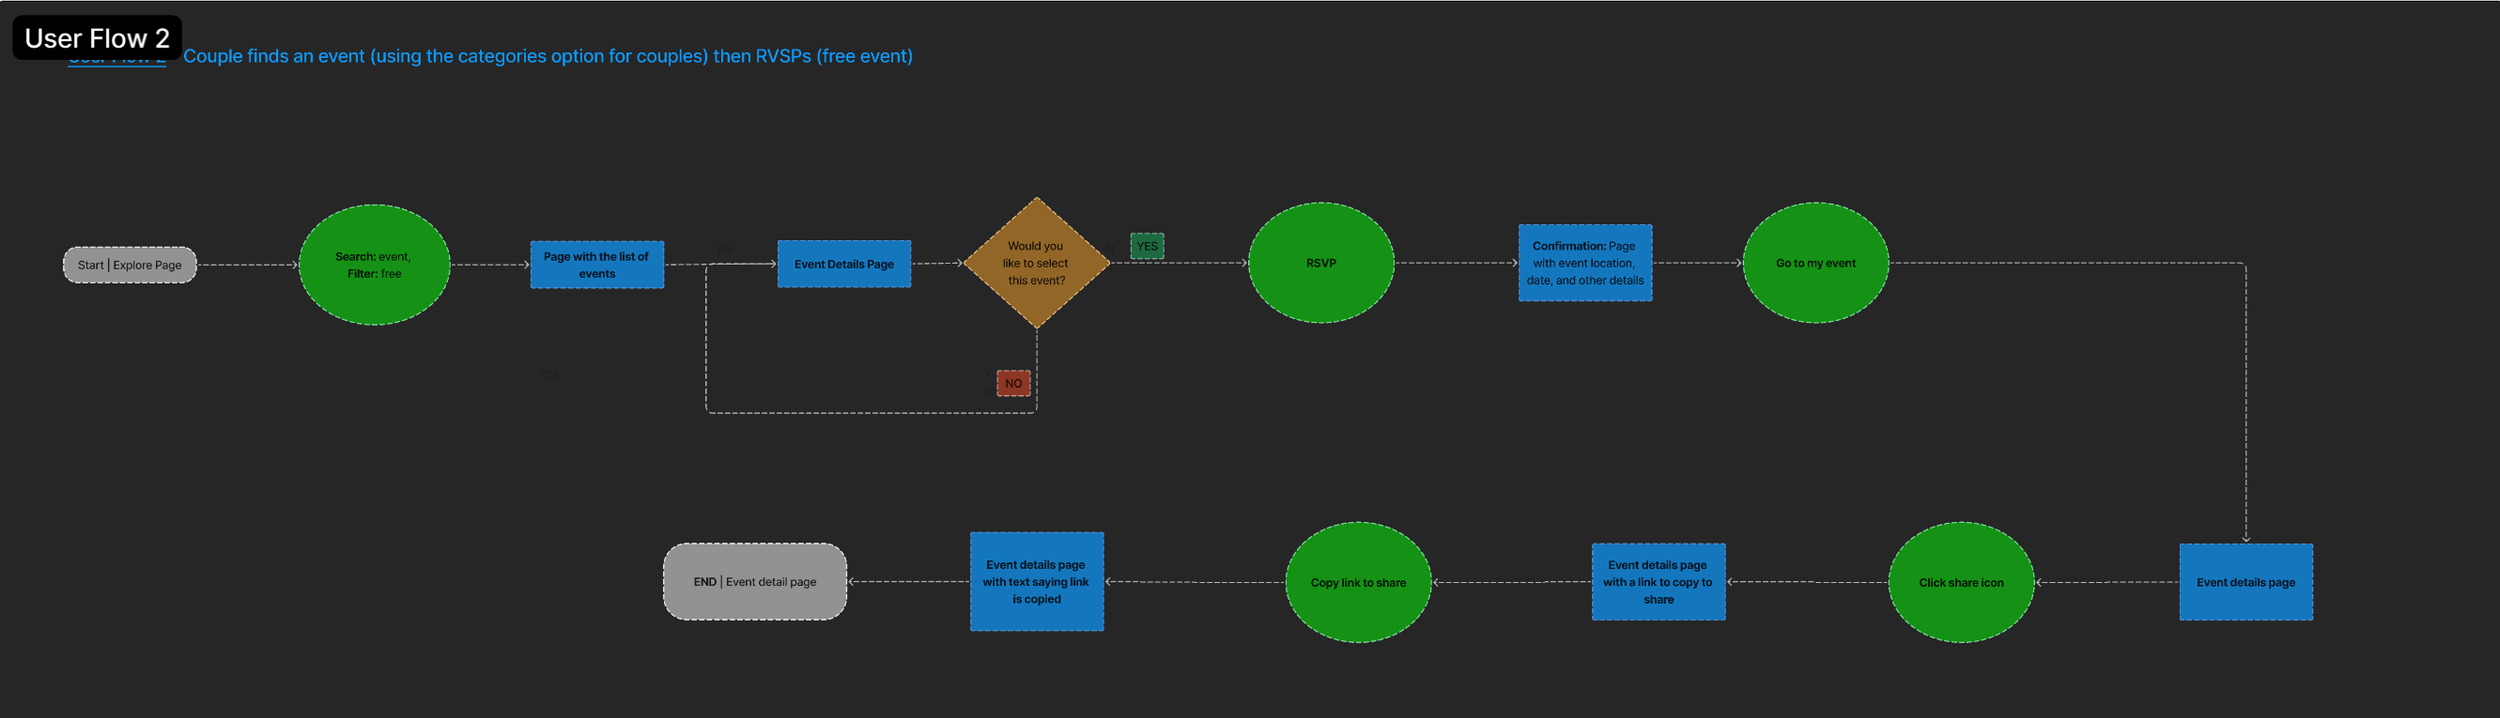
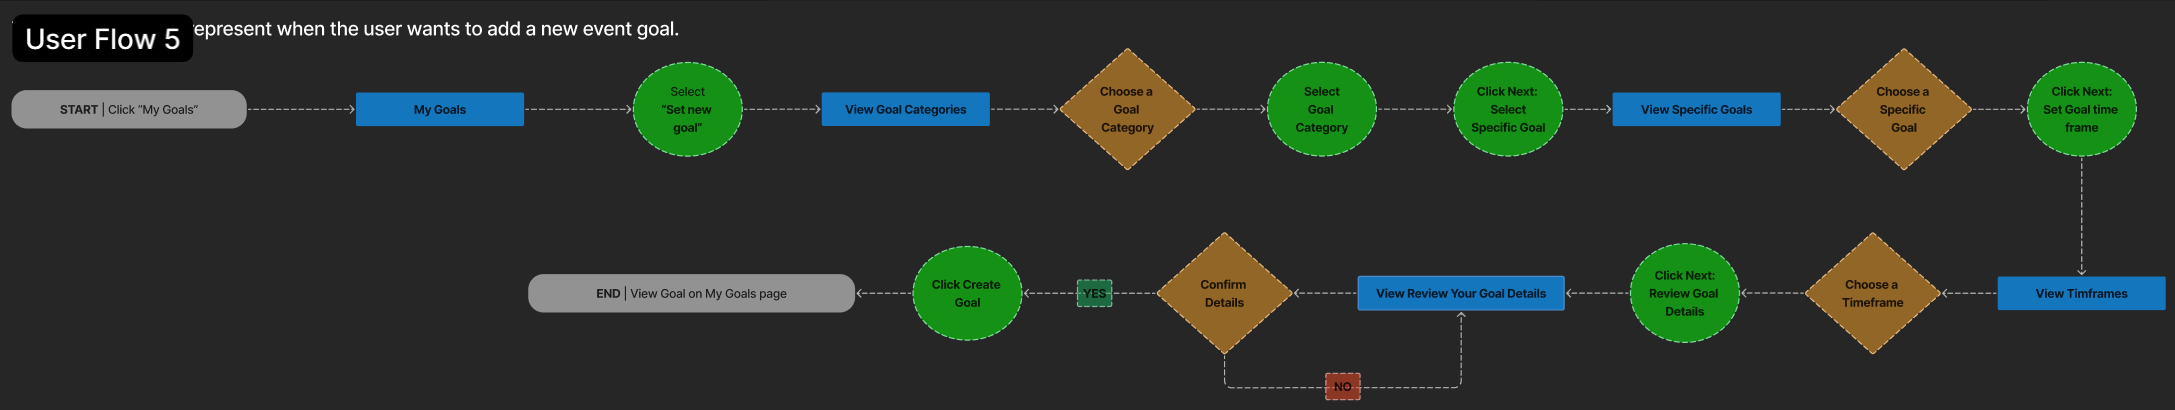
User Flows
We created the flowcharts to map key user journeys within the Butterfly app, connecting user goals with event discovery, filtering, and social engagement. This helped ensure a logical flow, reduced friction, and aligned navigation with real user needs for a smooth, intuitive experience.

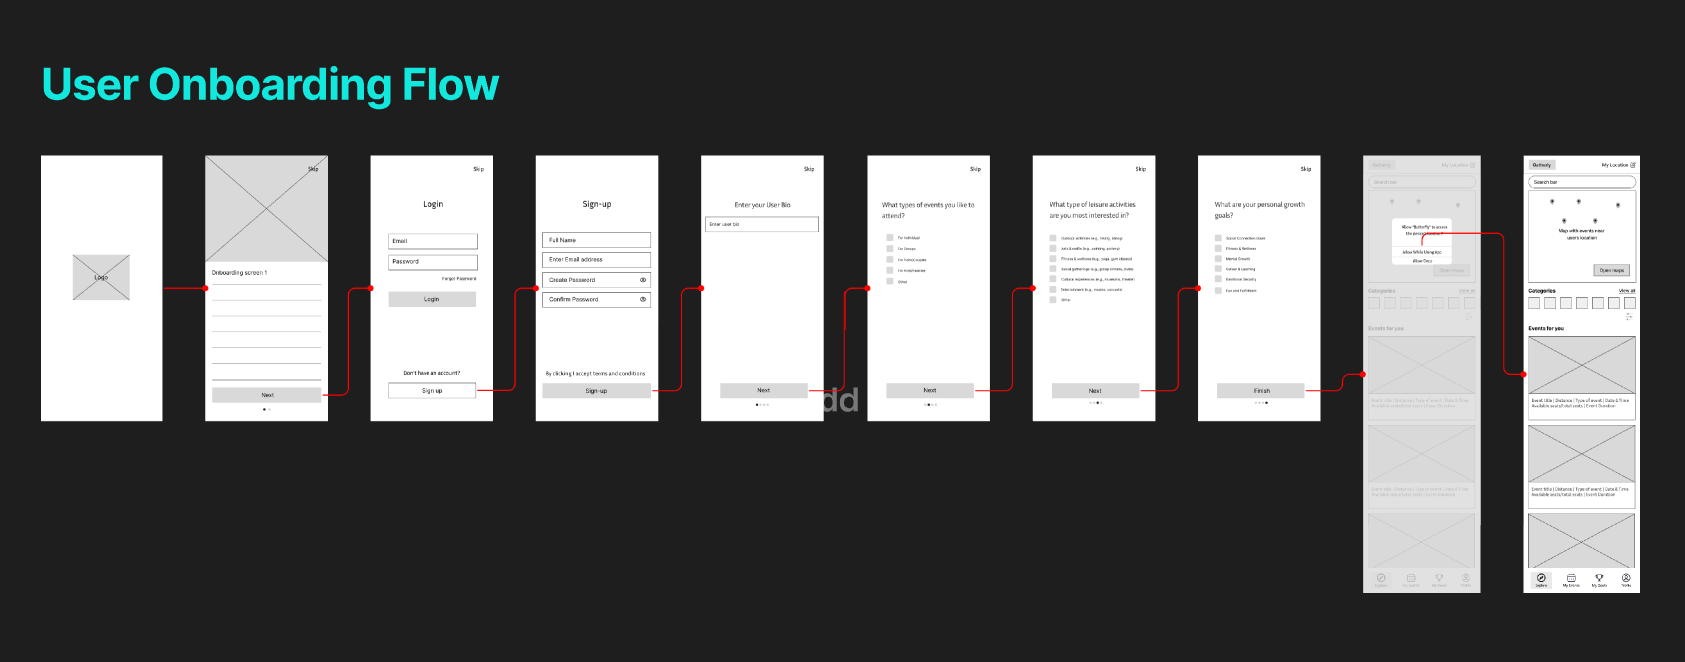
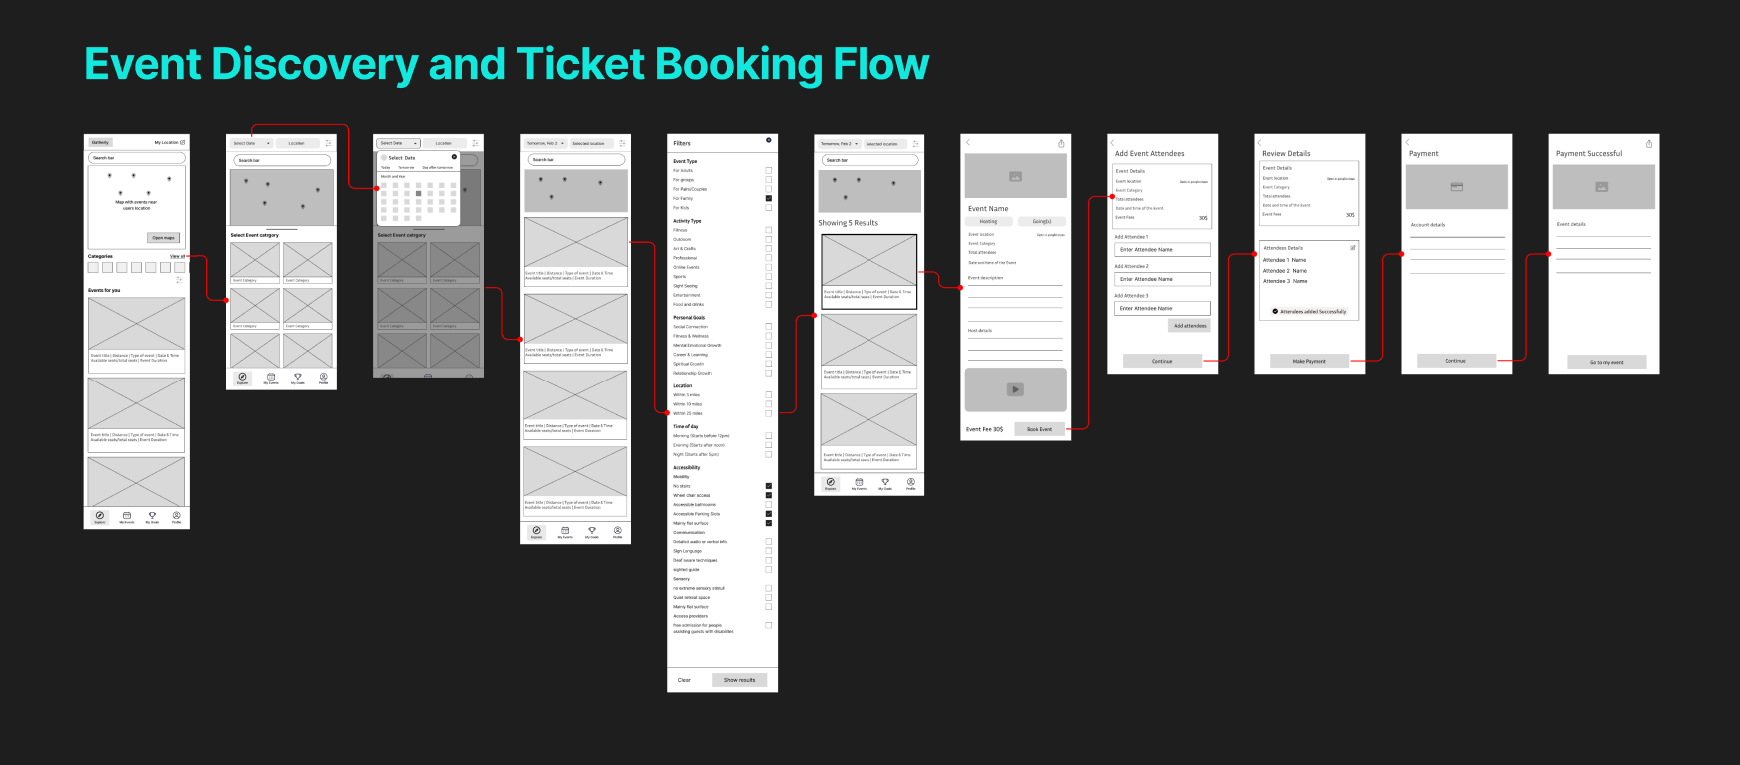
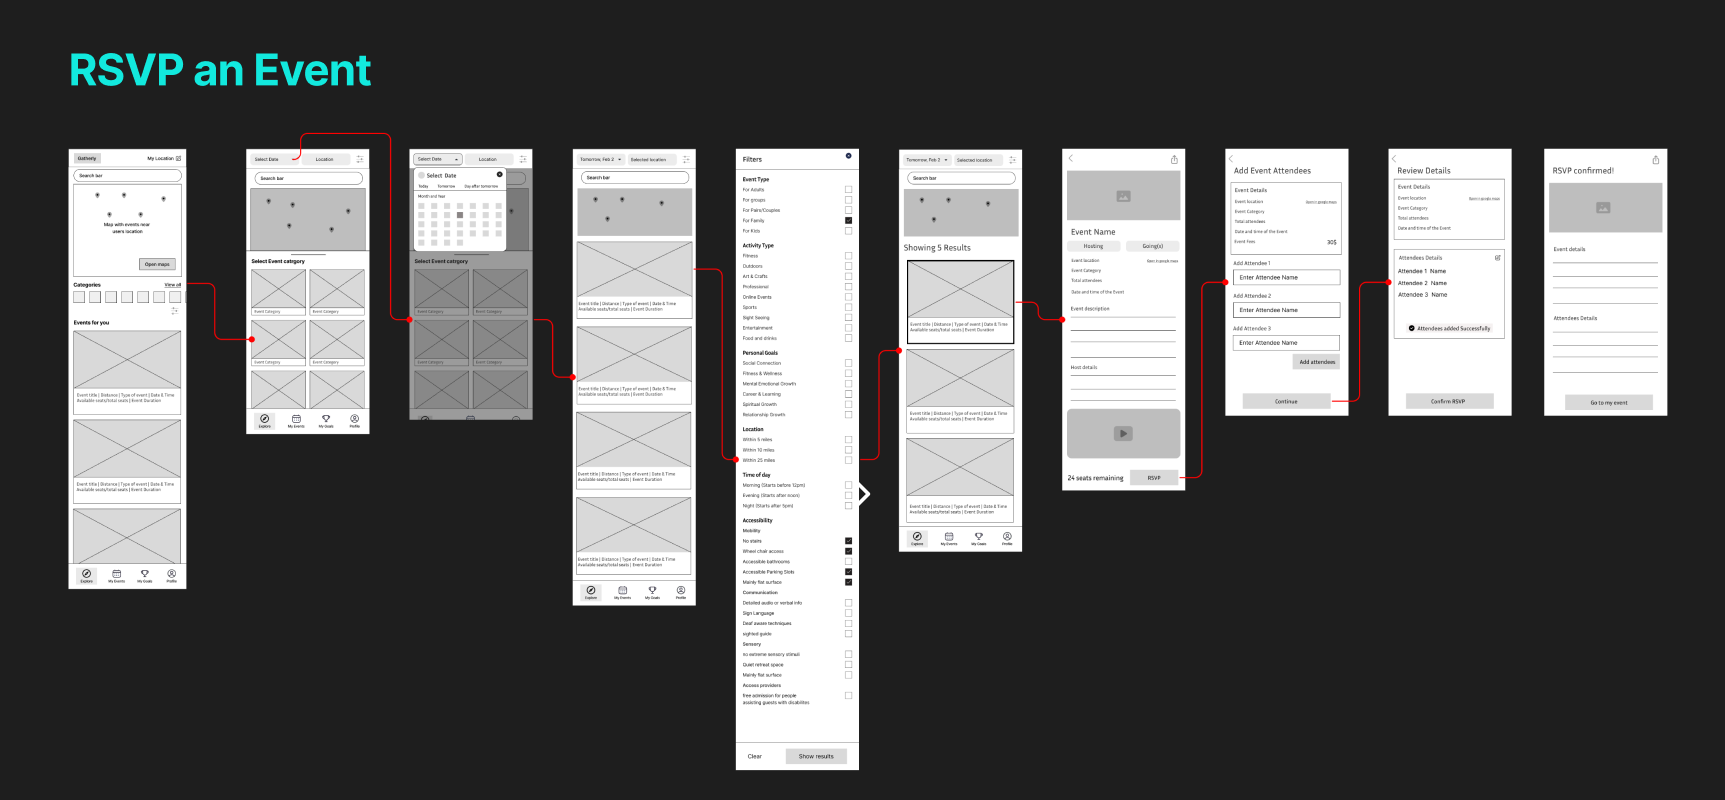
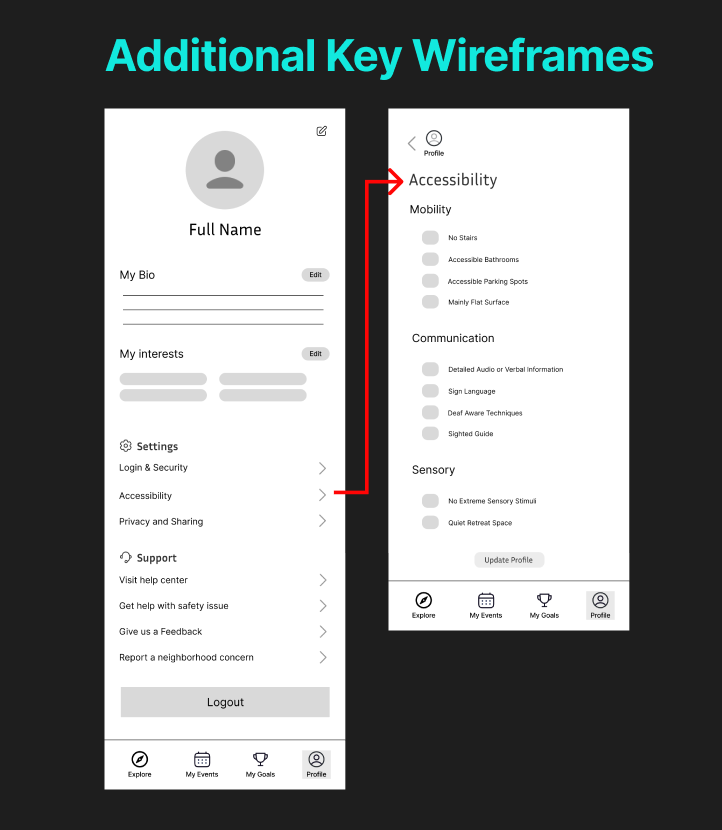
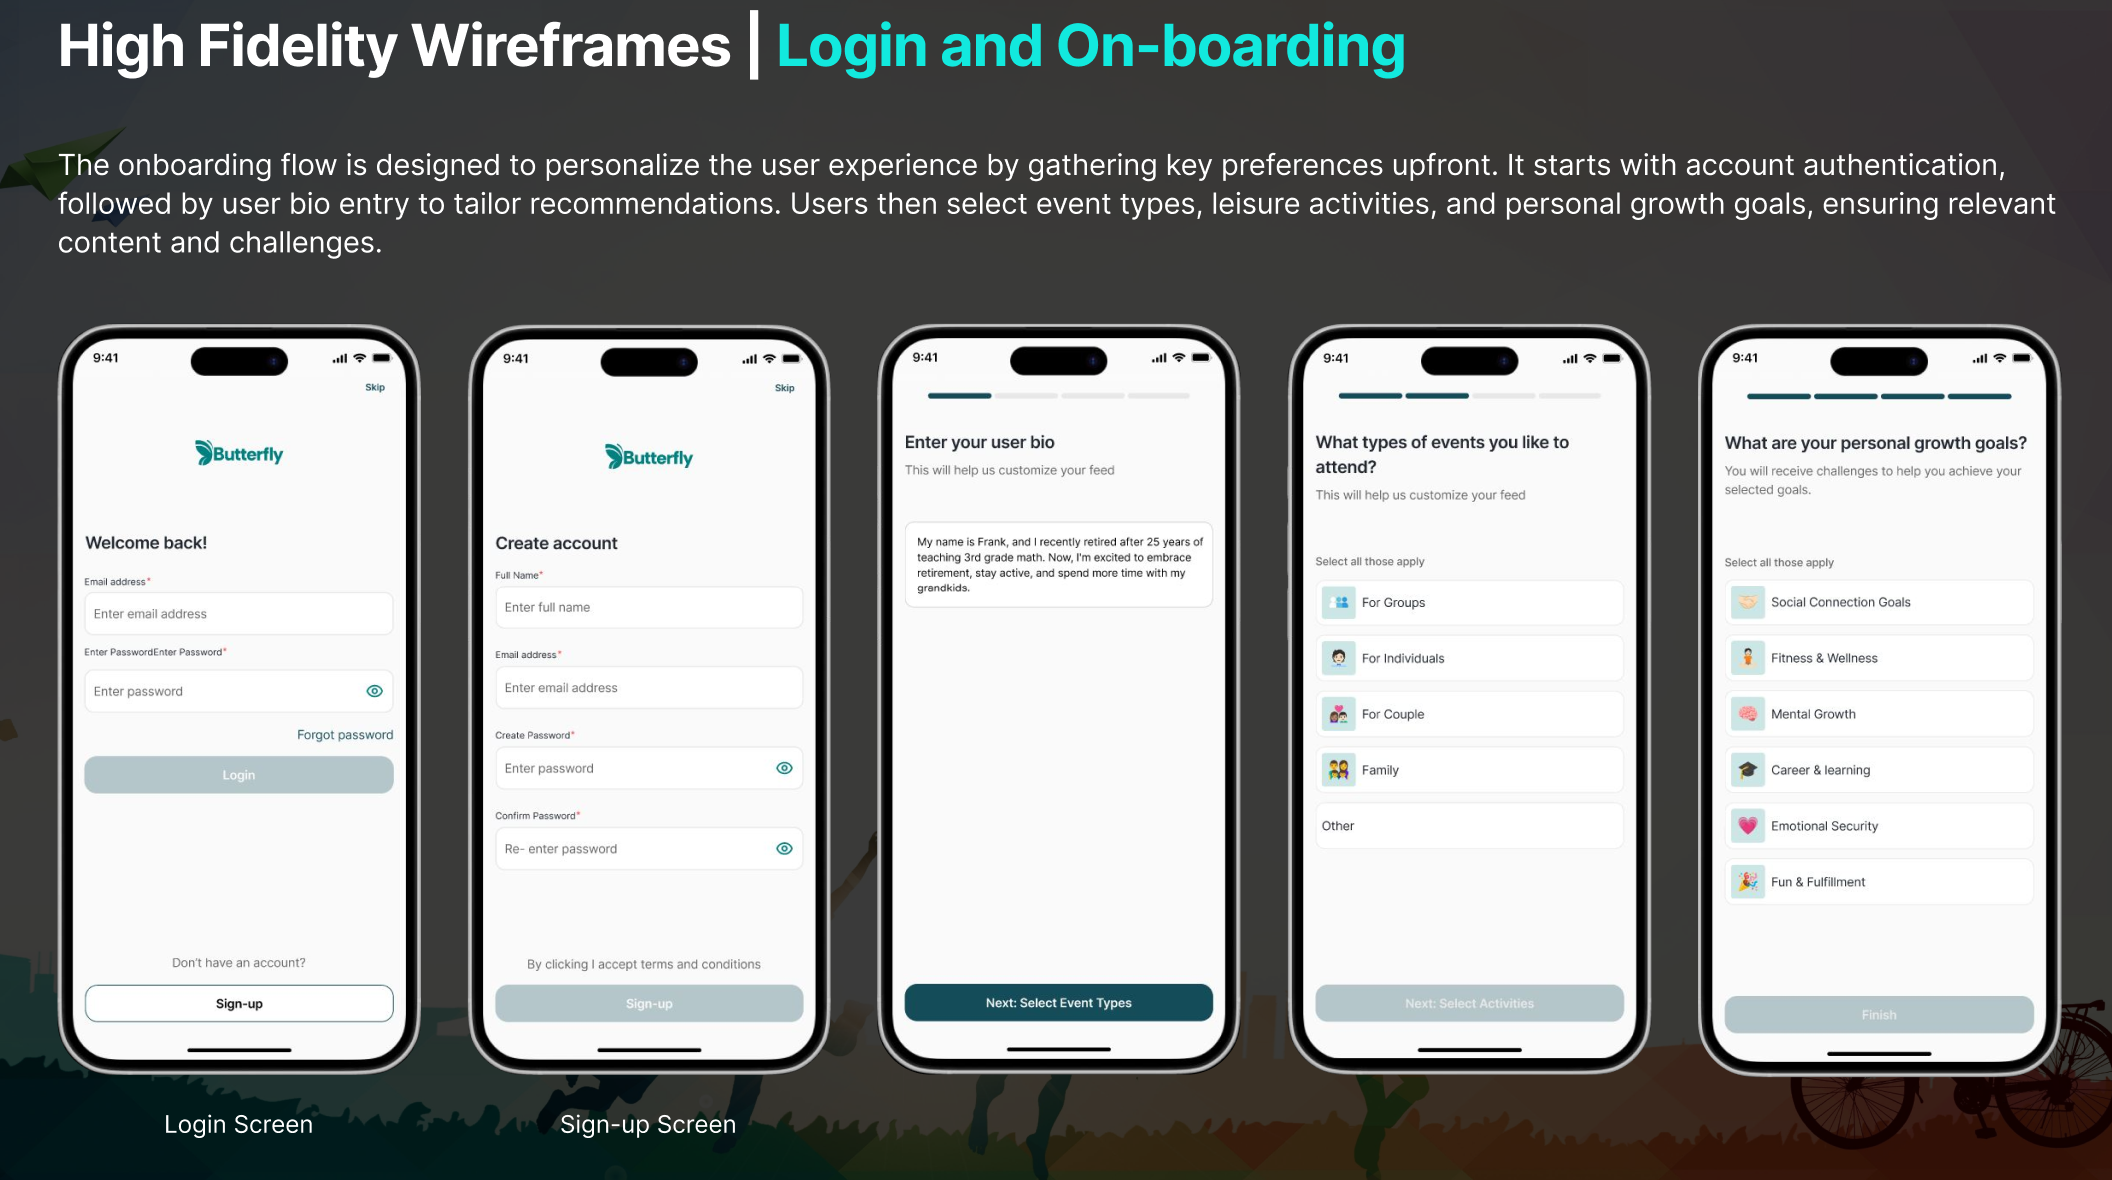
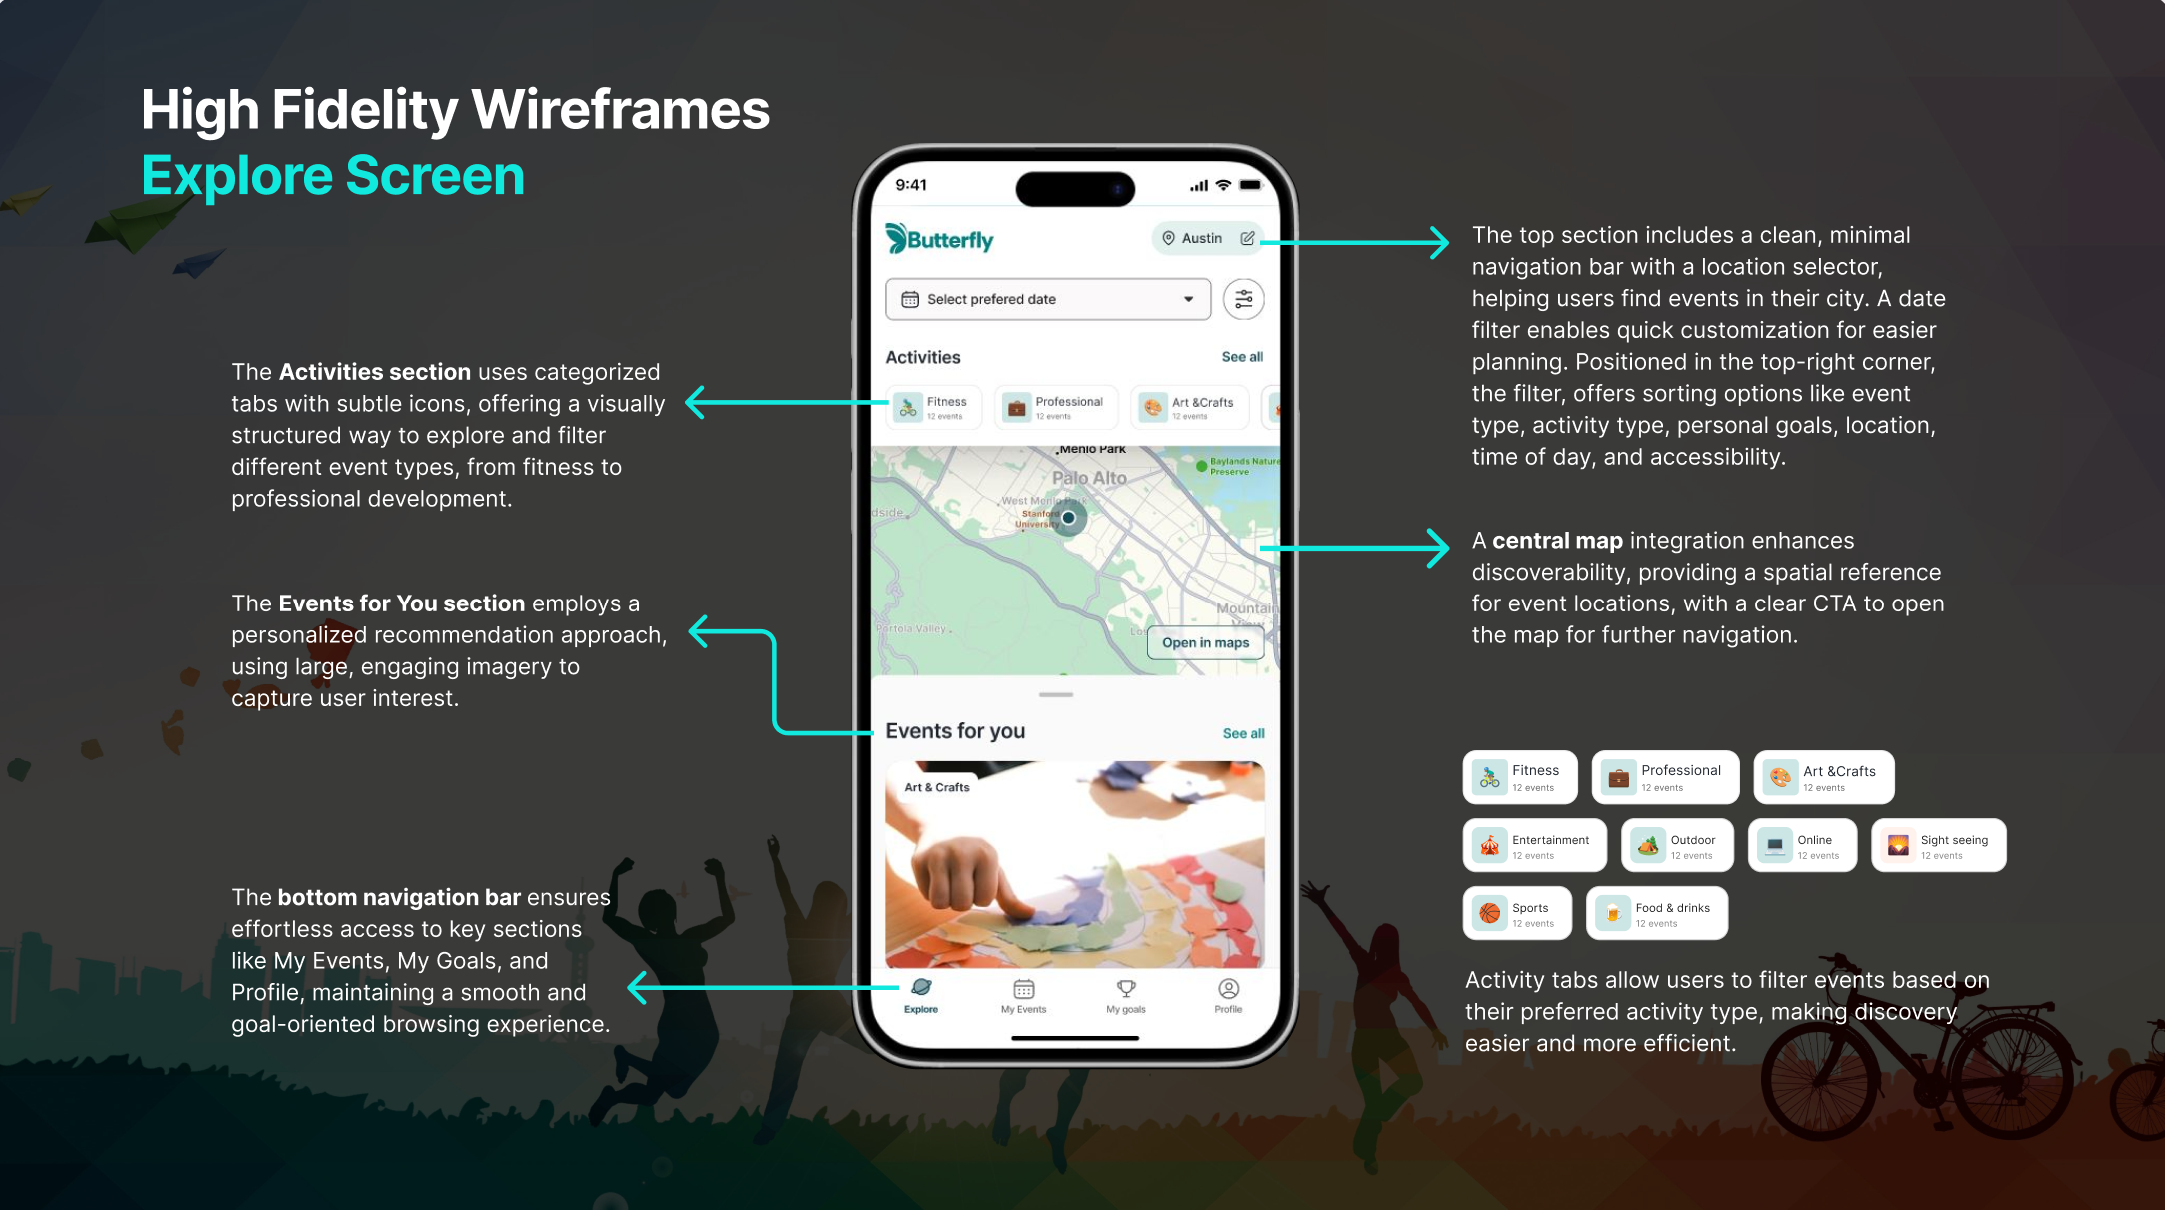
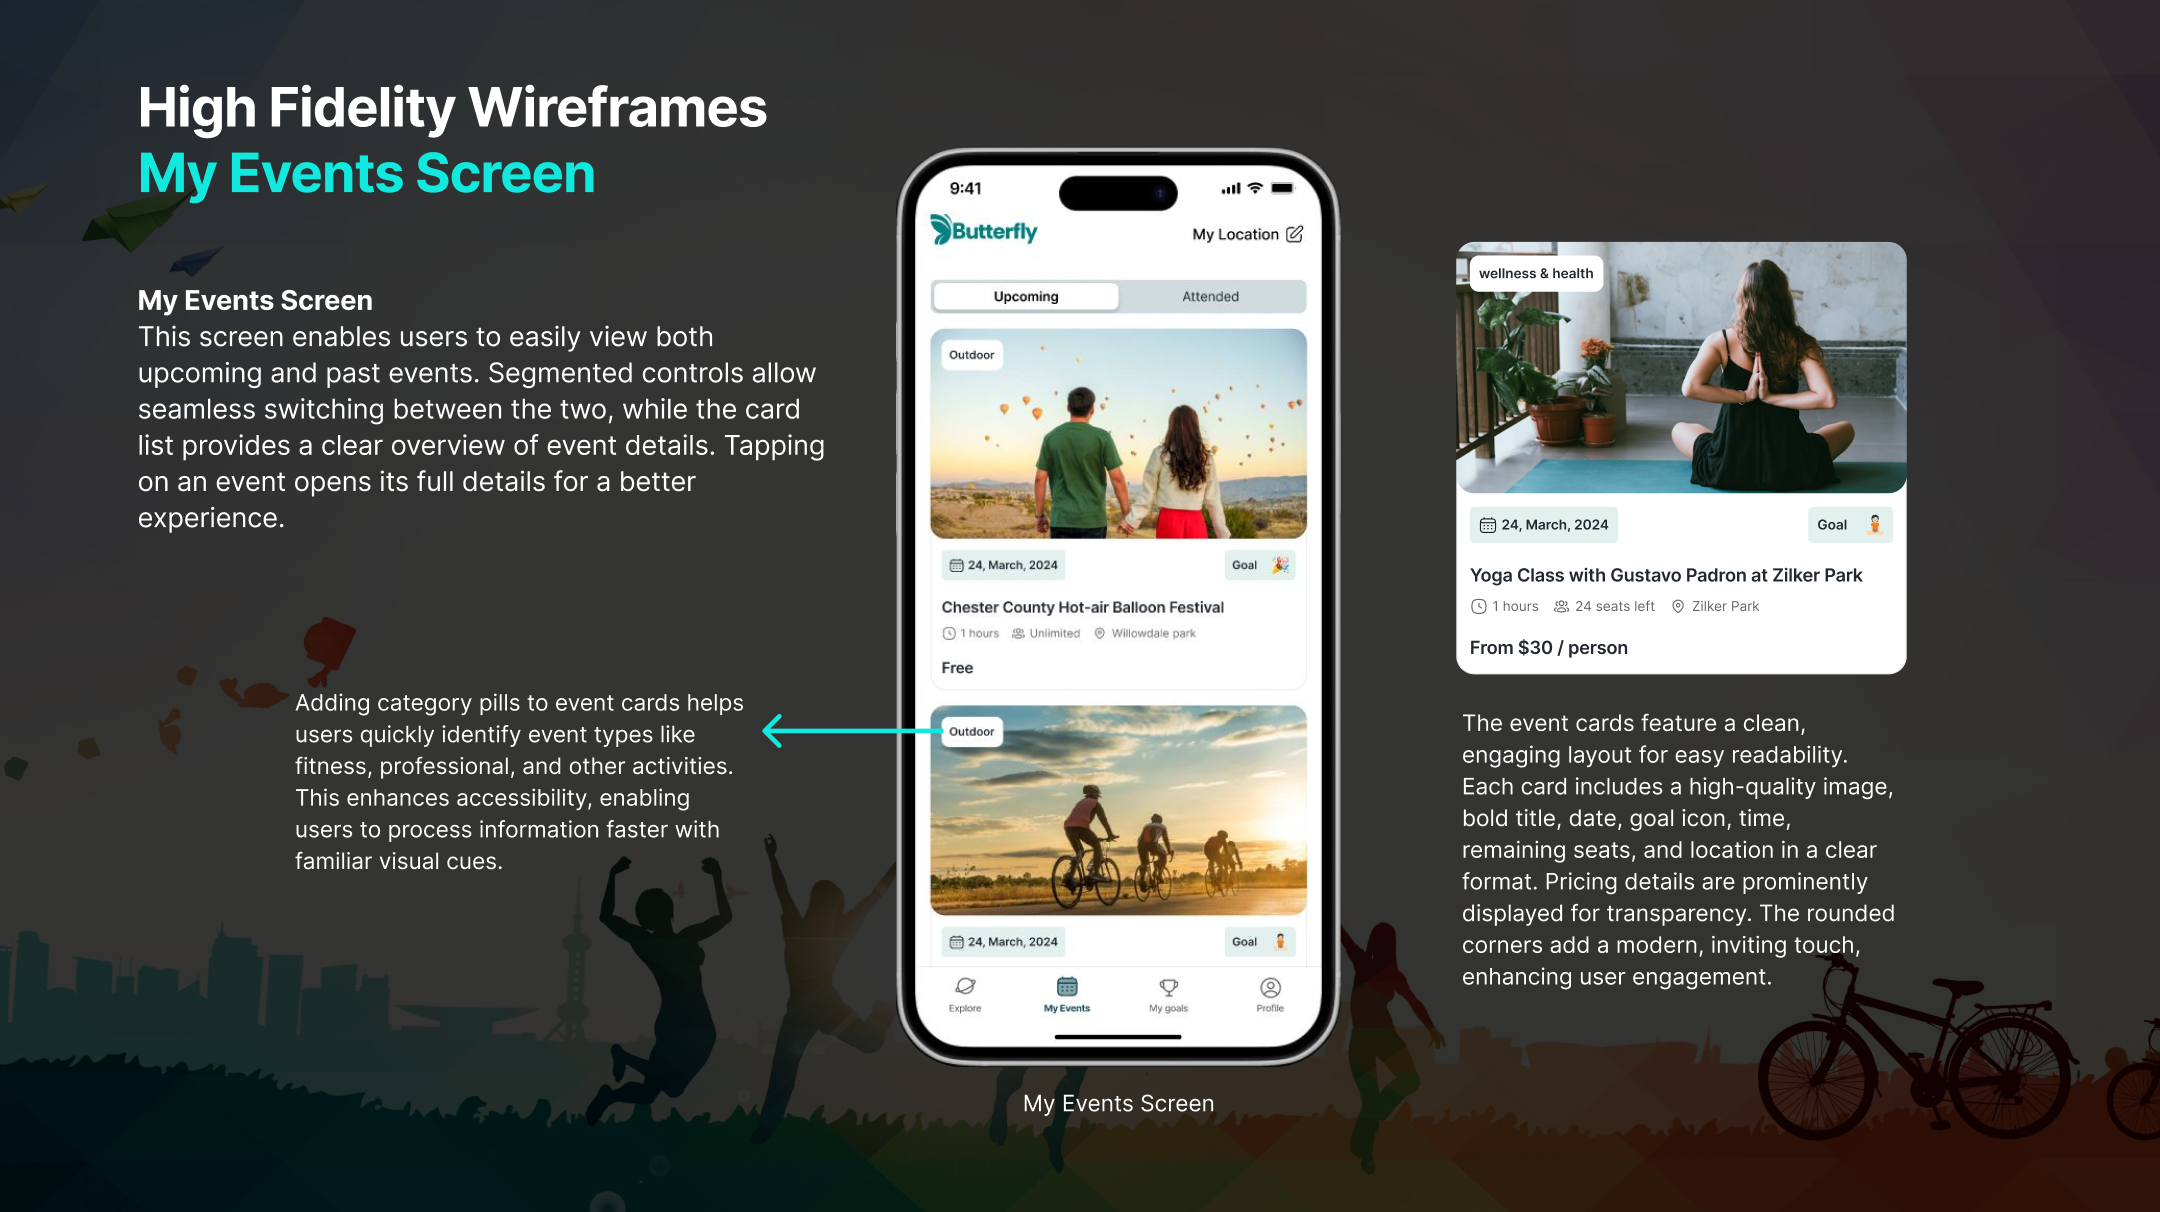
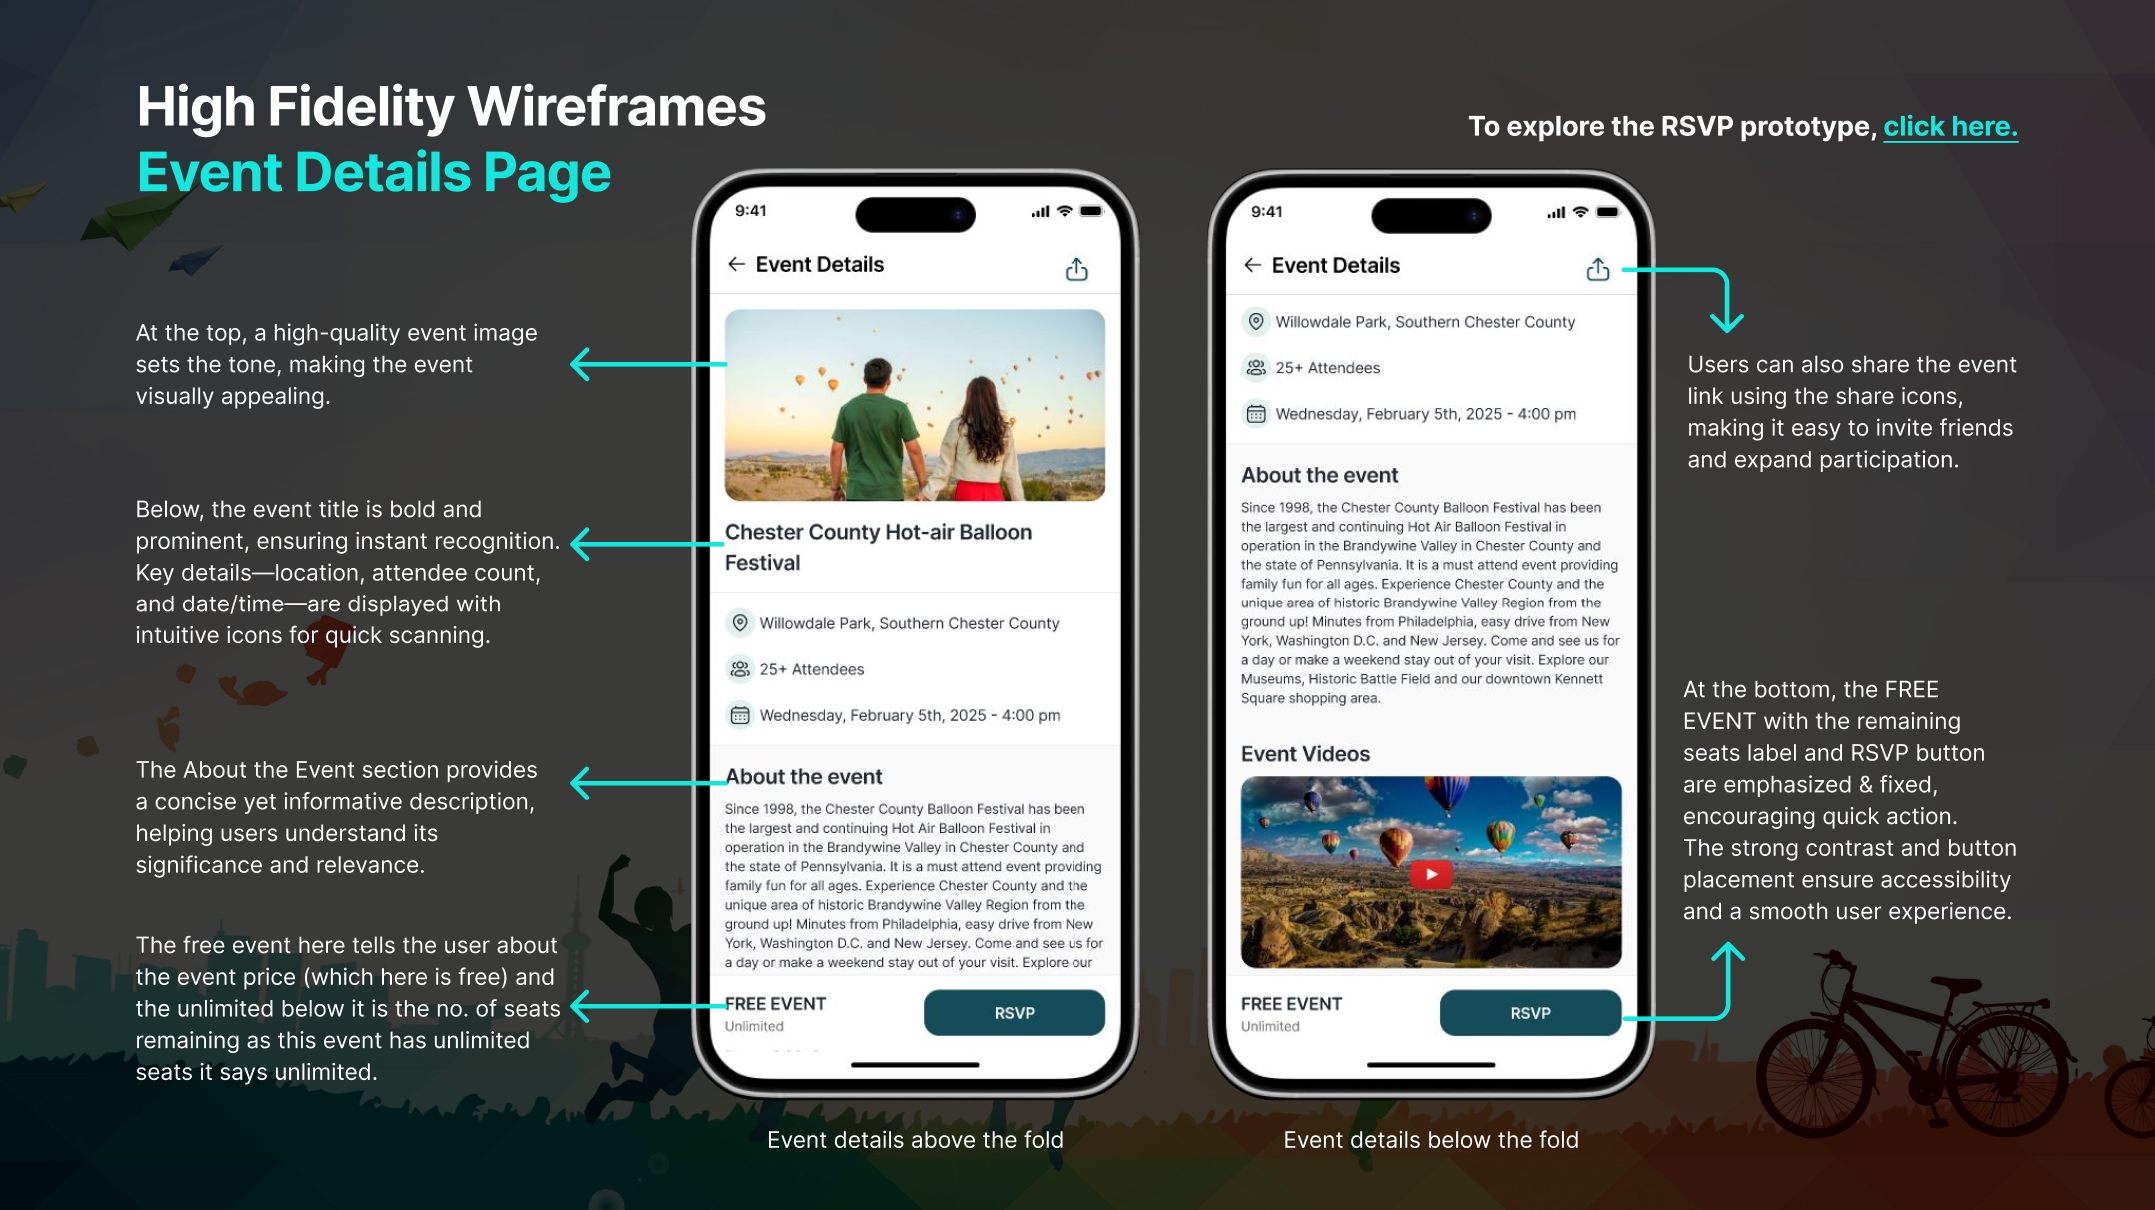
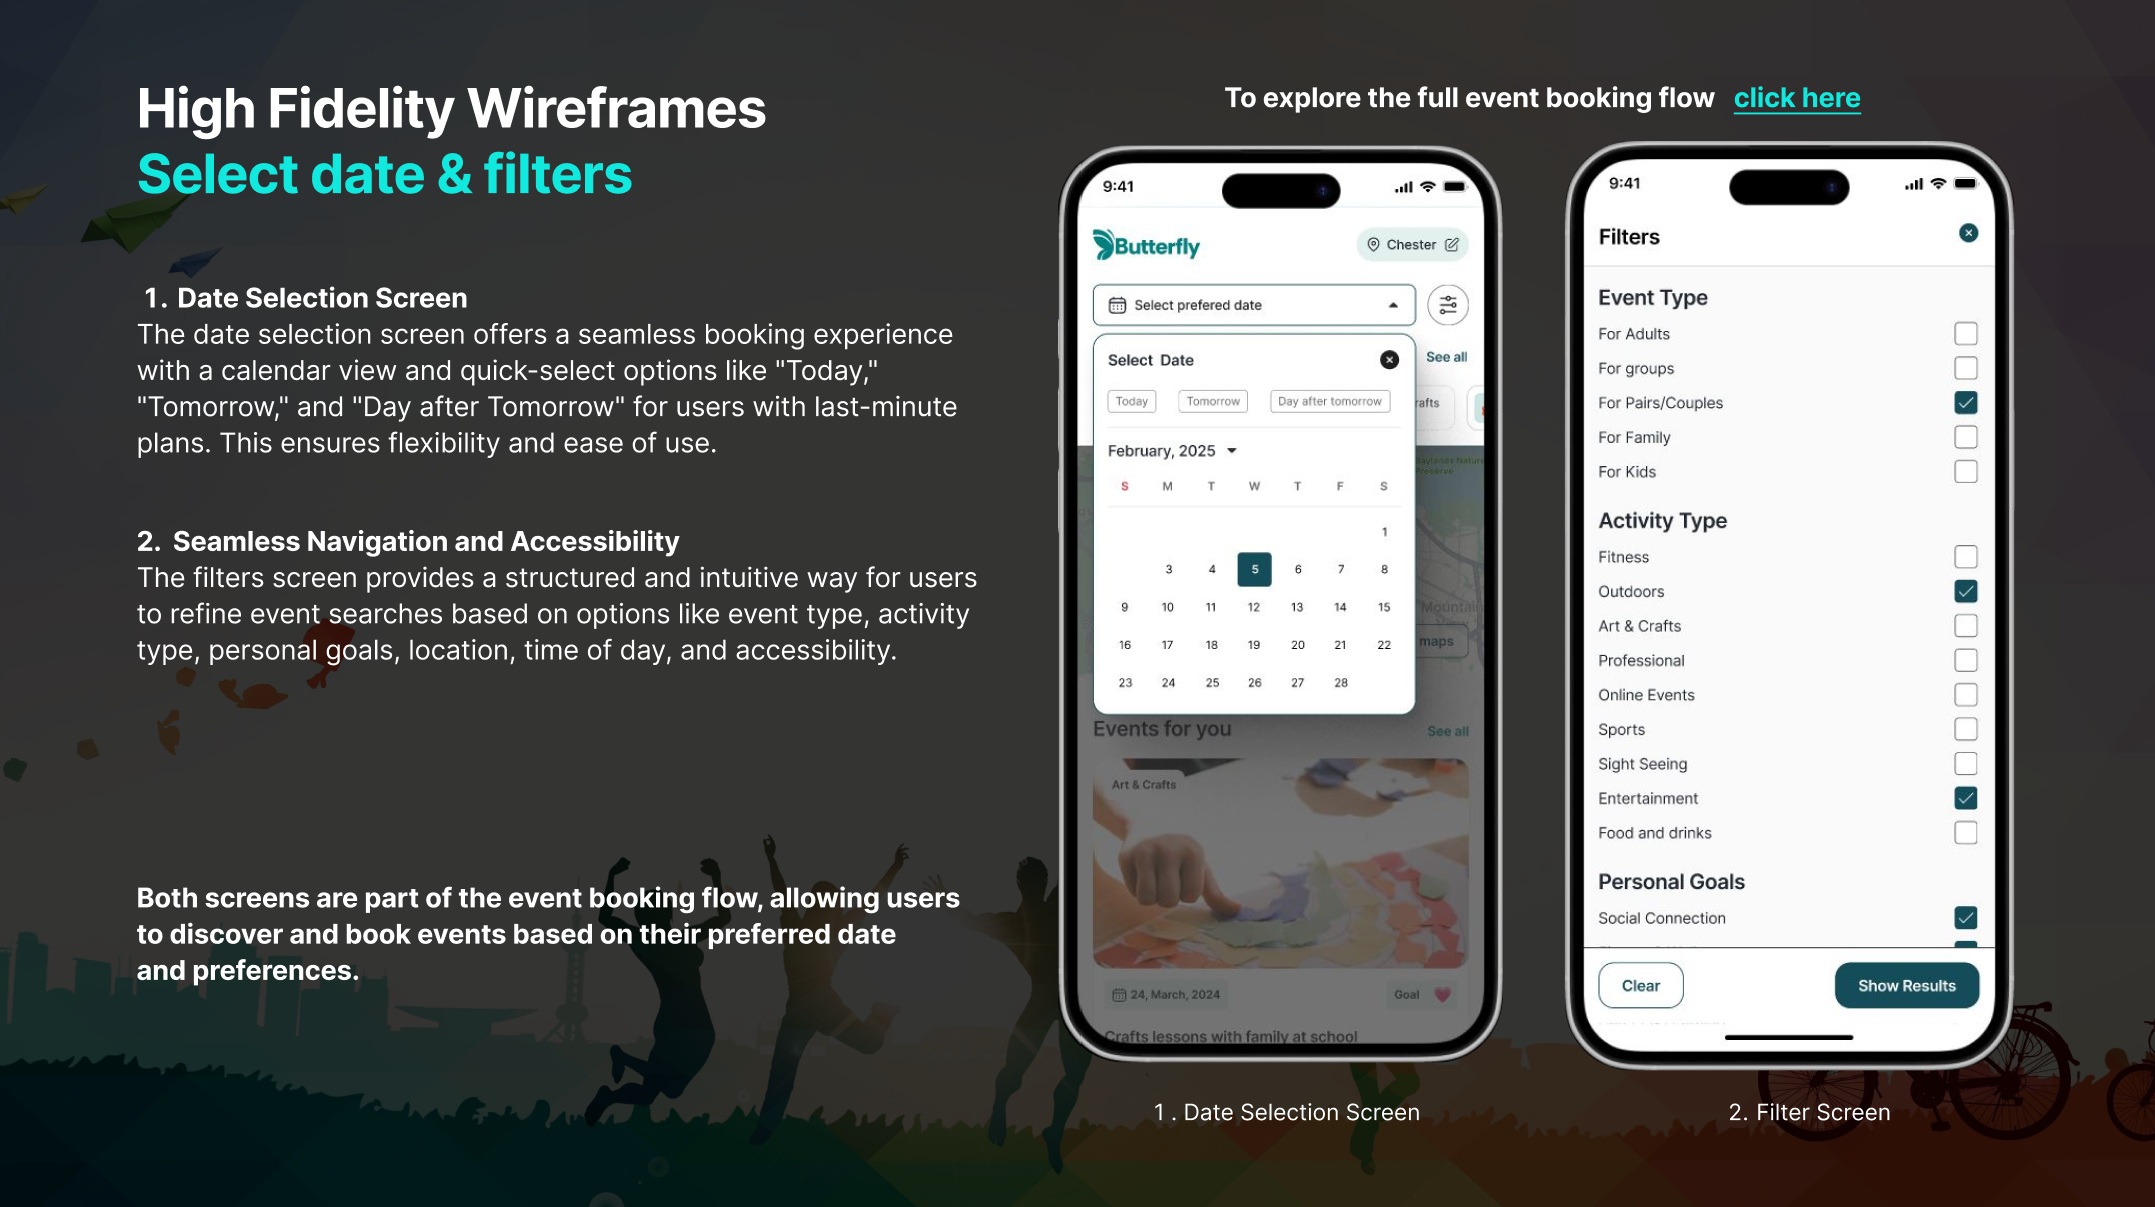
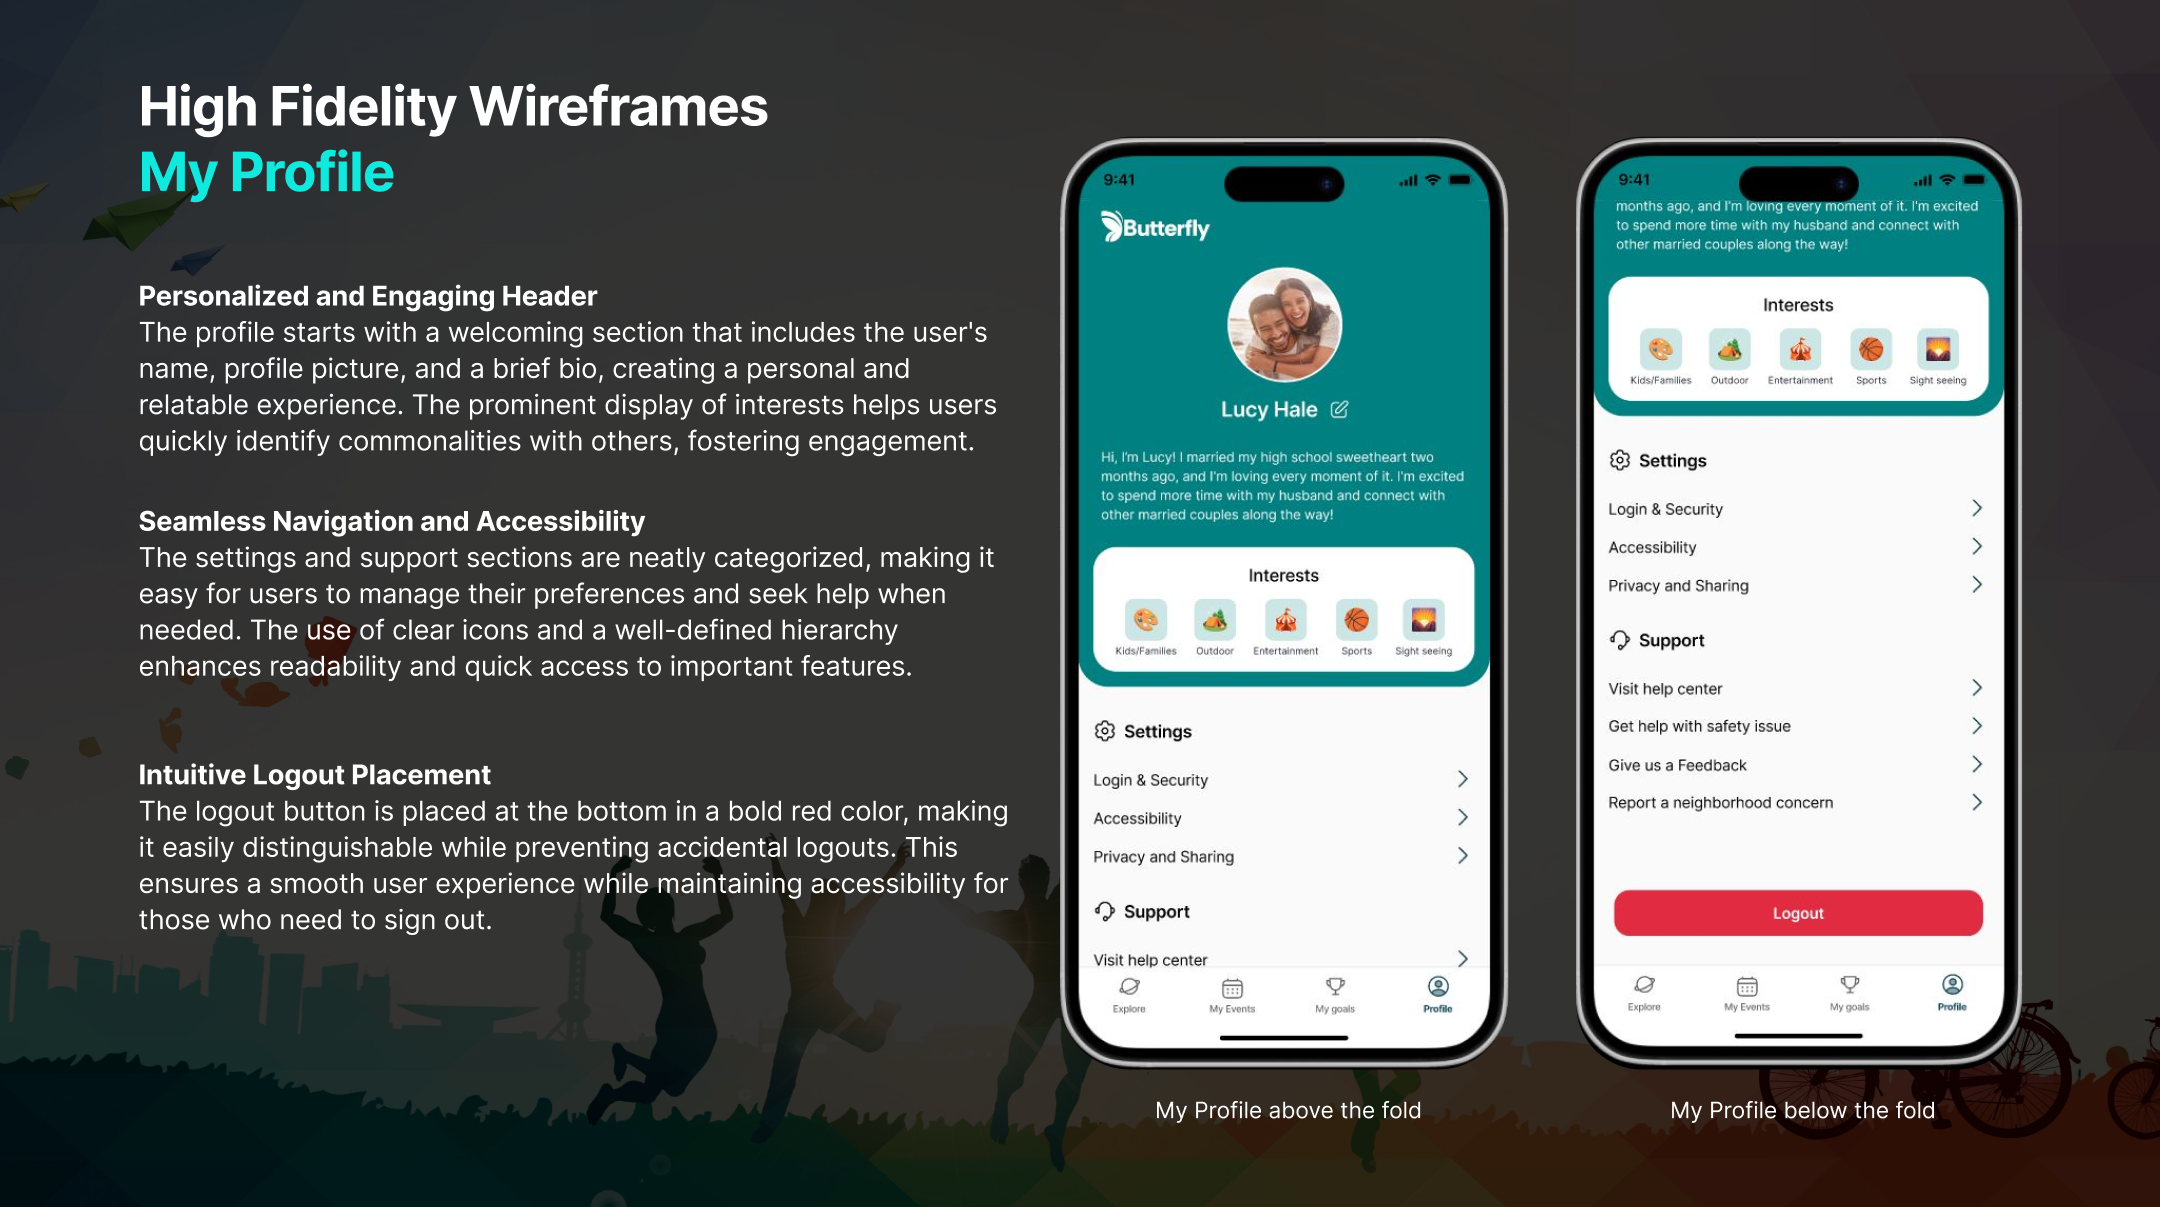
Wireframes
Wireframes were created directly from the flowcharts to translate user journeys into clear screen layouts. This ensured each step in the flow—discovery, filtering, and event selection- was intuitive, logically connected, and aligned with user goals.
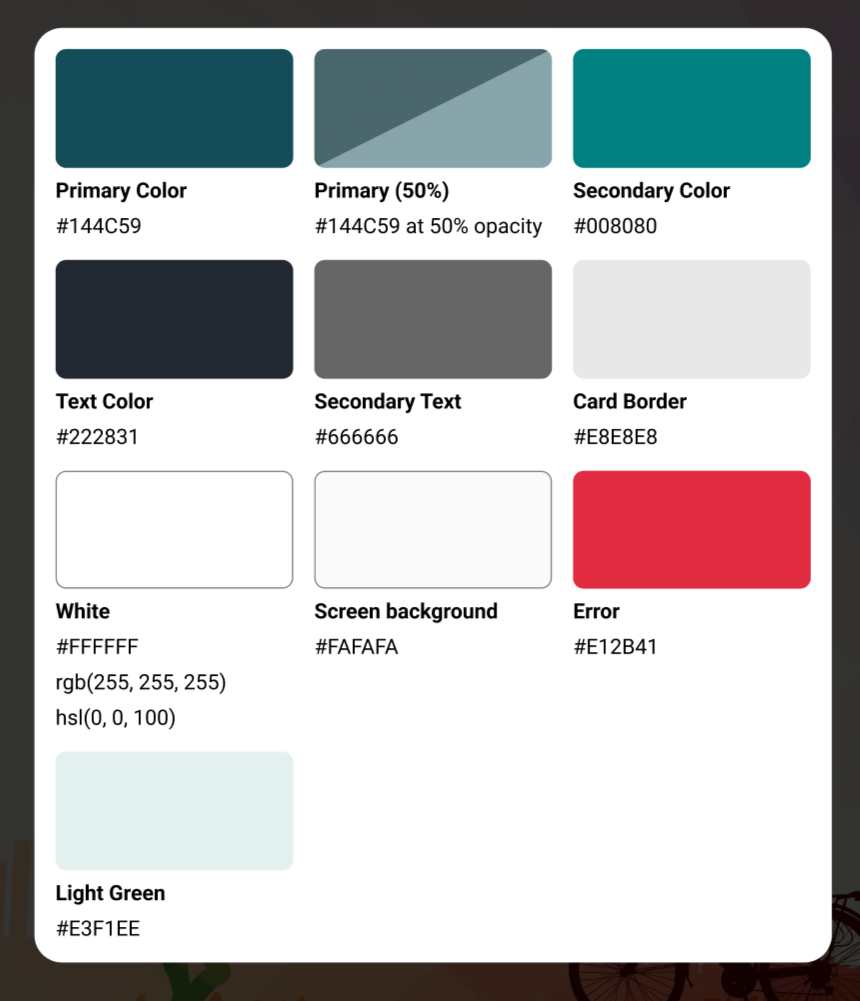
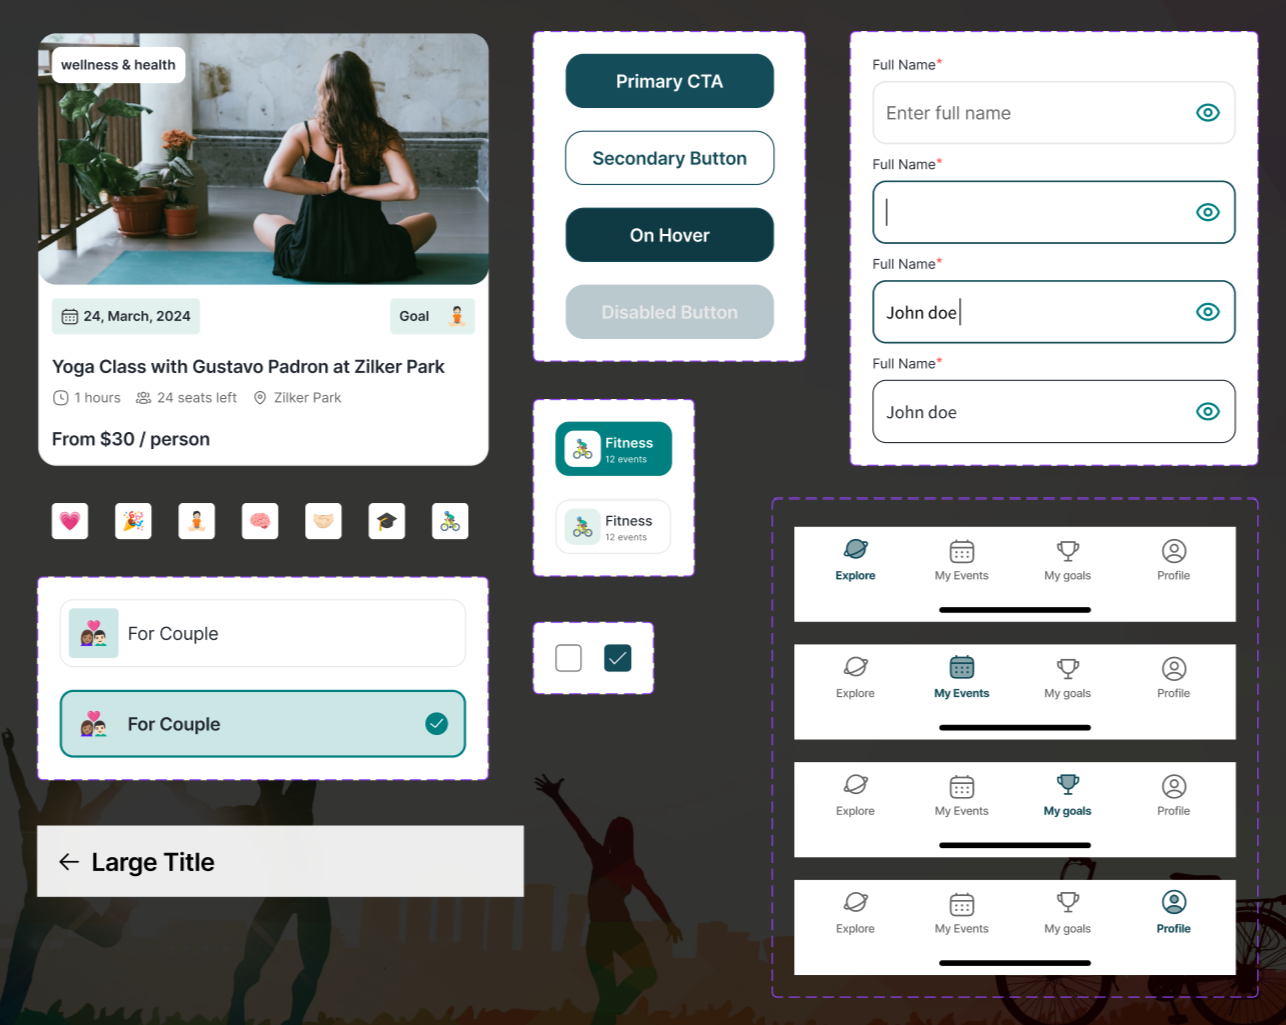
Design System
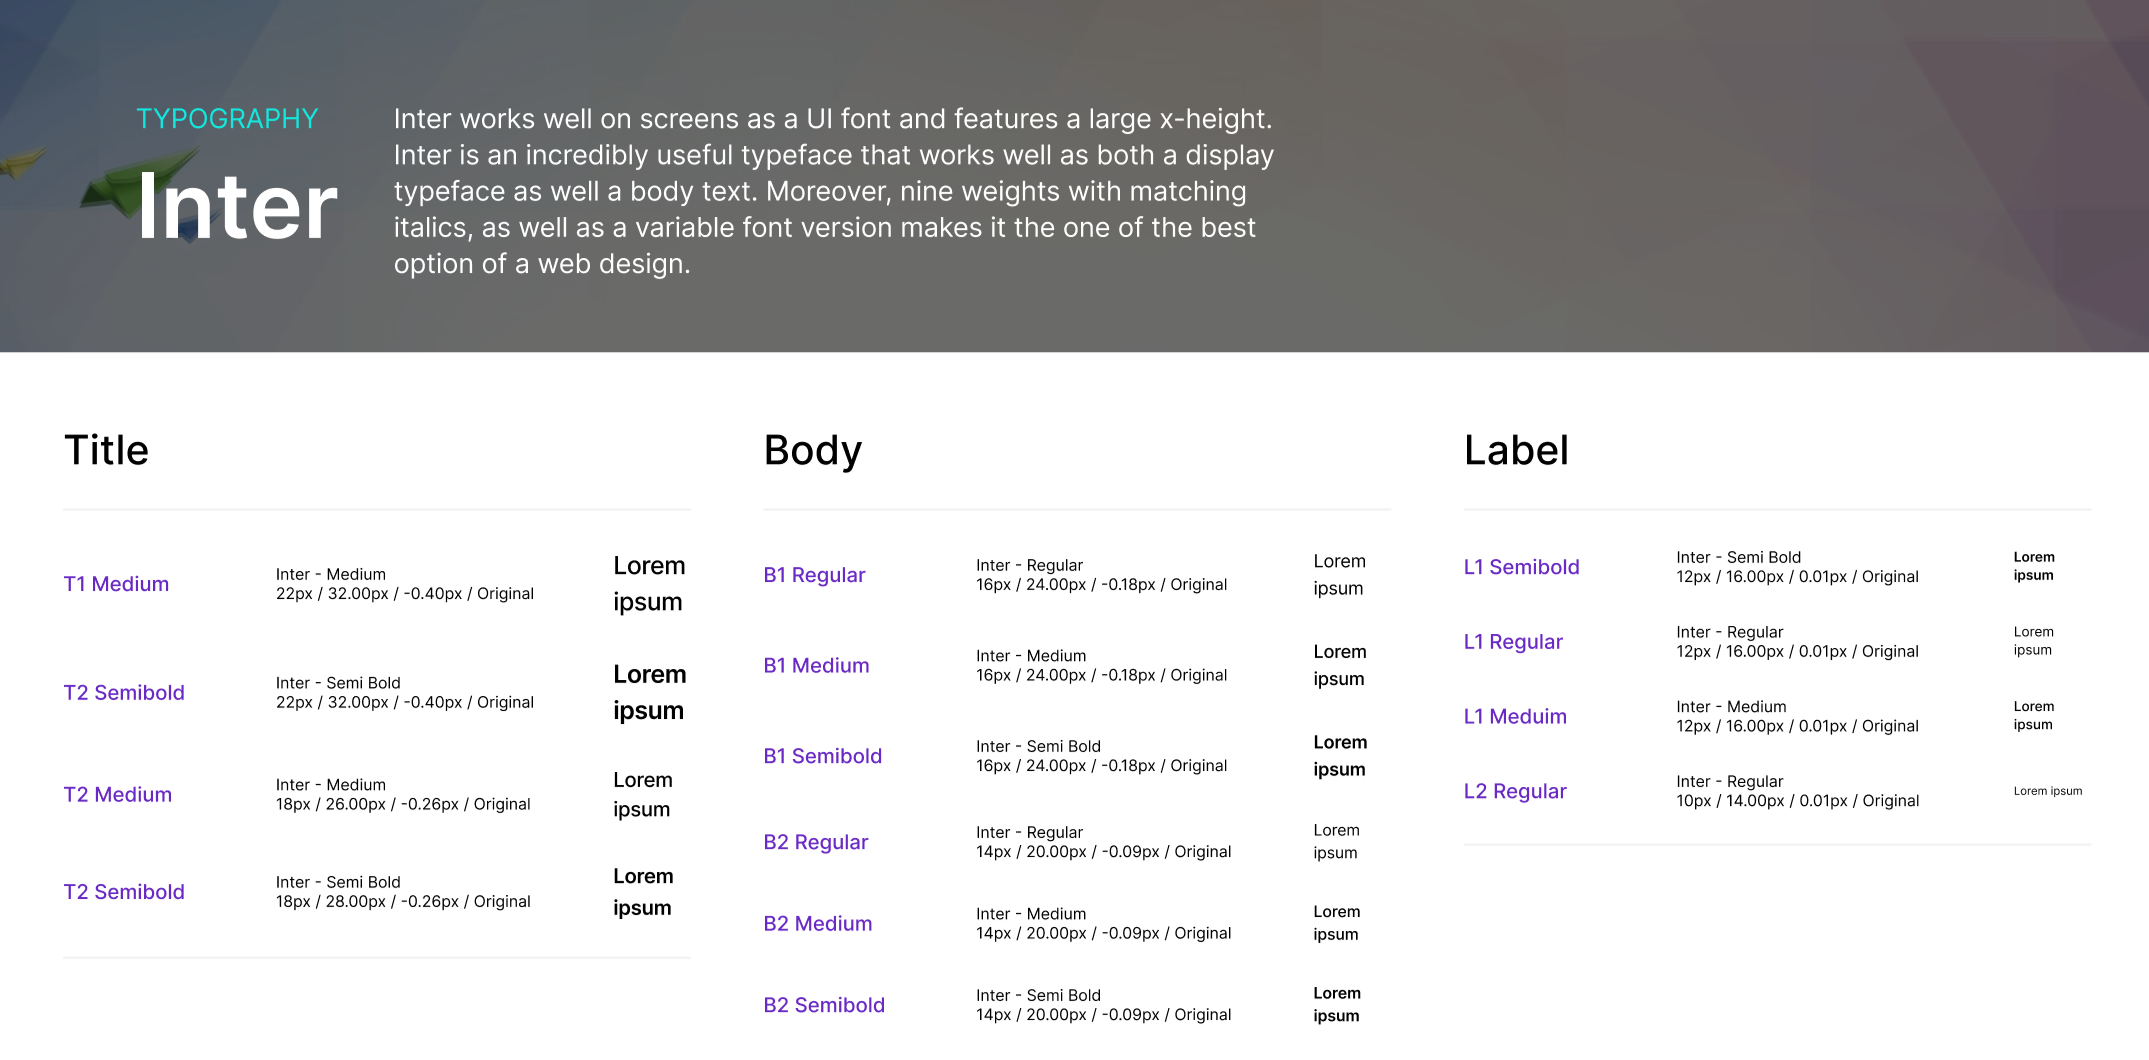
The UI design uses a calm yet motivating color system, with deep teal (#144C59) as the primary color to convey trust, focus, and ambition, supported by vibrant teal accents and neutral tones for clarity. Light green adds balance, while red highlights important actions. A structured component library with reusable UI elements ensured consistency and scalability, and Apple’s Human Interface Guidelines were followed to deliver a familiar, seamless iOS experience.
Prototype
A scalable design system was created with consistent colors, typography, and UI components, which was then used to build an interactive prototype to simulate real user interactions and validate the overall experience.
Validation
Accessibility testing was conducted for the Butterfly app prototype to ensure an inclusive and user-friendly experience. The prototype was evaluated against WCAG 2.1 AA guidelines, focusing on color contrast using a Figma plugin, typography readability by ensuring a minimum body text size of 16px and clear line spacing, touch target sizes, clear labeling, and logical focus order. Manual reviews and user feedback helped identify accessibility gaps, which were used for design iterations to improve clarity, navigation, and overall usability for users with diverse abilities.
Interactive Prototypes
User Onboarding (Creating a Profile) and Login by entering the user preferences and Bio.
Setting a goal by selecting the goal categories and time frame to complete the goal.
RSVP for an event and share.
Challenges
Challenge: Designing an intuitive event discovery system balancing structured IA with personalized recommendations.
Solution: Incorporated a gamified challenge system to boost motivation while keeping the interface simple.
Focus: Iterative testing ensured UI clarity, accessibility, and usability.
Consideration: Designed for future scalability, including rewards and community interaction features.
Outcome: Overcoming these challenges strengthened the UX strategy and engagement design.
Takeaways
The Butterfly project is a user-centered event discovery app with a clear, accessible UI and a structured Information Architecture. It uses gamification to boost engagement and encourages personal growth and social connections. The MVP demonstrates scalable UX solutions, with future plans for rewards and community features, highlighting expertise in research, gamification, and usability.
